

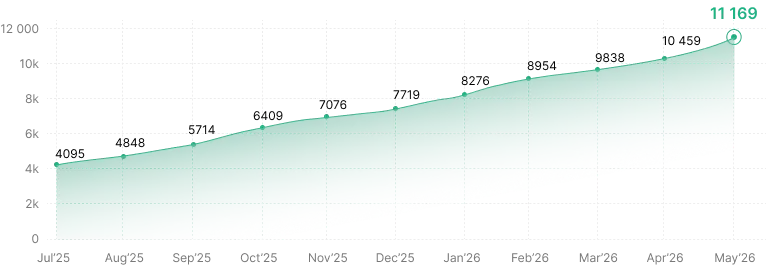
121M+Total Funded
Average annual return across diversified P2P portfolios
P2P lending delivers competitive yields by connecting you directly to borrowers


P2P platforms often show annual returns between 7% and 12%, though actual results depend on loan type and investor choices
Average annual return across diversified P2P portfolios
Typical time for first interest payment to arrive
Minimum amount needed to start on most platforms
Investors who spread across 50+ loans or more
Platforms reporting returns over the past five years

Investors who received at least one interest payment each month.

Rated 4.5 / 5 based on 779 reviews. Showing our 4 & 5 star reviews.
Six factors that influence how much you earn from P2P investments
Higher grades mean lower default risk but smaller returns. Lower grades can pay more but carry greater loss potential.
Investing small amounts across many loans helps smooth out defaults. Most experienced investors hold at least 100 loans.
Check how often borrowers fail to repay. Lower default rates preserve more of your capital and interest income.
Money sitting uninvested earns nothing. Auto-invest features help keep your capital working without manual effort.
Three-year loans may pay higher rates but tie up funds longer. Shorter terms offer flexibility at slightly lower yields.
Some platforms let you sell loans early. Others require holding until maturity, which affects your ability to react.
Direct lending cuts out traditional bank overhead, which means more interest flows to you instead of middlemen
No fees for deposits, investments or withdrawals.
A growing community built around transparent investing.
Average amount invested by active users each month.
Average interest paid to active investors each month.
Compare annual yields, default rates, and minimum investment amounts across leading P2P lending marketplaces

Supplies consumer electronics to major retailers and telecomes like Technomarket and Magnum-D

Processes, freezes and dries fruits and vegetables in a modern, fully equipped organic-focused production facility

Supply, installation and maintenance of agricultural and food equipment

Average annual return17.6%
Earned return€460
Promotions€0
Estimated returns based on target rate of 14.6% APY. Actual returns may vary. Past performance does not guarantee future results.
Features worth checking before you commit capital to any platform
Track defaults and repayment rates by loan type, grade, and borrower profile before choosing
Set criteria for loan grade, term, and amount so your money deploys according to plan
Some platforms maintain reserves to cover defaults, reducing individual loan losses
Certain originators promise to repurchase delinquent loans after a set period
Sell loans before maturity if you need liquidity or want to exit positions
Visual breakdowns show concentration risk across loan types, terms, and geographies
See when interest and principal arrive so you can plan reinvestment timing
Model potential outcomes based on past platform performance and your allocation choices
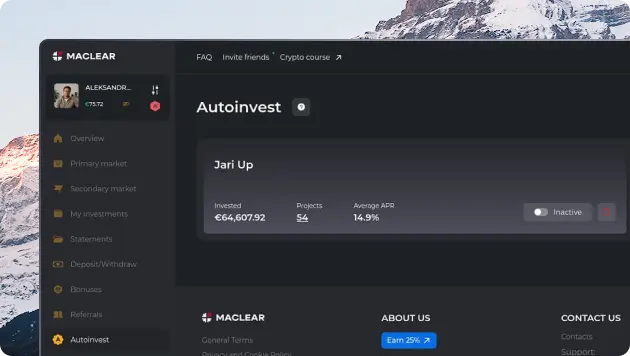
Live marketplace listings show current interest rates, borrower profiles, and remaining funding needed for each loan opportunity
Explore loans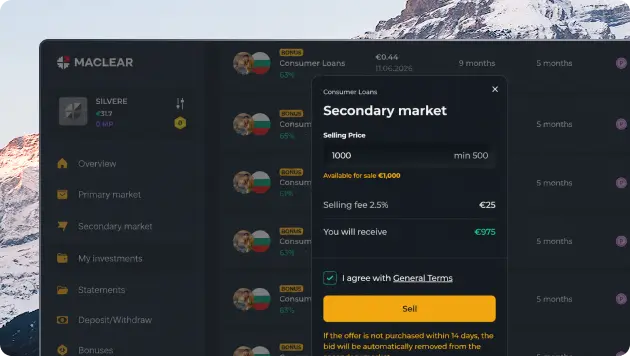
Platform fees and potential losses reduce your gross yield. Here's what investors typically see after accounting for both
Average platform service fee per year
Typical default rate across mixed portfolios
Open an account and begin investing in under ten minutes

Verify identity and link funding

Choose loan types and risk levels

Transfer funds and enable auto-invest
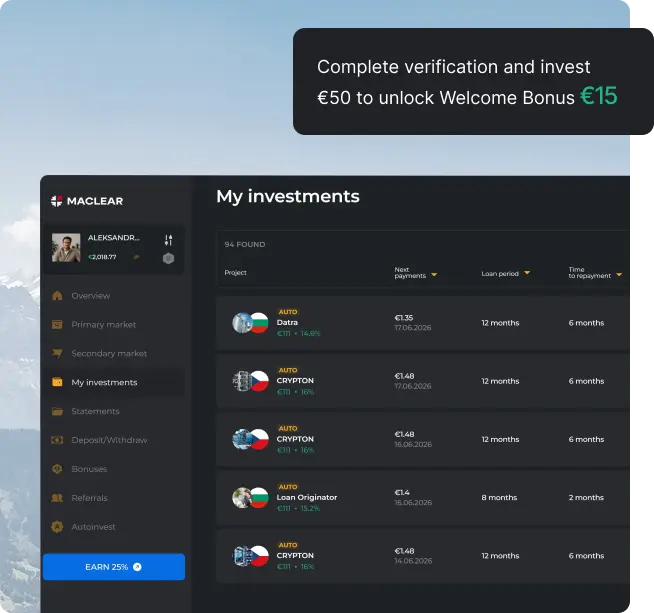

Some platforms offer cashback, reduced fees, or bonus interest when you maintain consistent investment activity

Earn credits for inviting others

Lower fees at higher balances

Extra yield after investing for months

Priority funding for top-tier borrowers

P2P investing suits people who can tie up capital for months or years, tolerate some defaults, and want higher yields than savings accounts. It's not a fit if you need guaranteed principal or instant access to funds.


All loan performance data, default rates, recovery outcomes, and investor returns are available without logging in. We publish monthly reports on new originations, repayment status, and platform-wide statistics so you can verify claims before investing.
 Collateral and the
Provision Fund help reduce certain risks, but do not eliminate investment risk.
Collateral and the
Provision Fund help reduce certain risks, but do not eliminate investment risk.

P2P lending platforms commonly deliver annual returns between 7% and 12%, depending on the loan grades selected and portfolio composition. Actual earnings vary based on borrower creditworthiness, platform default rates, and individual risk tolerance. Diversified portfolios across 50+ loans tend to produce steadier results.
Higher-grade loans carry lower default risk but offer smaller interest payments. Lower grades provide bigger returns but expose investors to greater loss potential. Balancing grades across a portfolio helps optimize risk versus reward according to individual goals.
Spreading capital across many loans smooths the impact of individual defaults. Most successful investors hold 100 or more loans to reduce volatility and protect overall returns. Concentrated portfolios face higher loss risk when borrowers fail to repay.
Six key elements shape earnings: loan grade selection, portfolio diversification, platform default history, reinvestment speed, loan duration, and secondary market liquidity. Each factor interacts to determine whether capital grows steadily or faces friction. Investors who optimize all six typically exceed those focusing on just one or two.
Cash sitting uninvested generates zero interest. Platforms offering auto-invest features keep capital working continuously without manual intervention. Faster reinvestment cycles compound earnings over time, significantly boosting annualized returns compared to irregular manual investing.