Why Most Beginners Lose Money in the First Year
Data from a 2022 FINRA study shows that 72% of first-time investors either abandon their accounts or suffer net losses within twelve months. The pattern repeats across demographics, income levels, and geographic regions. The problem is not market volatility or bad luck. It stems from predictable errors in timing, allocation, and psychology.
The average beginner allocates capital before understanding basic principles. They buy individual stocks based on social media hype, ignore expense ratios on mutual funds, and panic-sell during routine corrections. These mistakes are expensive. According to Dalbar's Quantitative Analysis of Investor Behavior, the average equity fund investor underperformed the S&P 500 by 4.3 percentage points annually over the past two decades. That gap widens dramatically for accounts opened in the first eighteen months.
You can avoid this pattern. The key is structure: a repeatable process that removes emotion, limits downside risk, and compounds returns over time. This article walks through each component of that process, backed by transaction data and behavioral research. Maclear provides tools to help investors navigate these challenges systematically.
How Does Investing Work at the Account Level
When you invest, you purchase an asset with the expectation that its value will increase or generate income. Stocks represent partial ownership in a company. Bonds are loans you make to corporations or governments that pay interest. Real estate investment trusts (REITs) pool capital to buy property and distribute rental income. Exchange-traded funds (ETFs) bundle dozens or hundreds of these assets into a single security that trades like a stock.
Returns come from two sources: price appreciation and income. A stock priced at $50 that climbs to $55 delivers a 10% capital gain. A bond paying 4% annual interest delivers that rate regardless of price fluctuations, assuming the issuer does not default. Dividends from stocks and distributions from REITs add another layer. The S&P 500 returned an average of 10.2% annually from 1957 through 2023, split roughly two-thirds from price gains and one-third from reinvested dividends.
Risk is the possibility that your asset declines in value or the issuer fails to pay. Stocks are volatile: the S&P 500 has declined more than 10% from recent highs during 28 separate periods since 1950. Bonds carry credit risk if the borrower defaults and interest-rate risk when rates rise. Cash equivalents like money market funds preserve capital but lose purchasing power to inflation, which averaged 3.1% annually over the past century.
The relationship between risk and return is not linear. Higher risk does not guarantee higher returns—it only increases the range of possible outcomes. A speculative stock might triple or go to zero. A Treasury bond will return its stated yield unless the government collapses. Understanding this distinction separates effective investors from gamblers. For those seeking safe investment options, diversification across asset classes is essential.
The First Asset You Should Own
Your first purchase should be a low-cost, broad-market index fund or ETF. Vanguard's Total Stock Market Index Fund (VTSAX) holds more than 4,000 U.S. stocks weighted by market capitalization. Its expense ratio is 0.04%, meaning you pay $4 annually for every $10,000 invested. Fidelity's ZERO Total Market Index Fund (FZROX) charges no expense ratio at all.
Index funds solve three problems simultaneously. First, they provide instant diversification. A single share of VTI—the ETF version of Vanguard's total market fund—gives you fractional ownership in Apple, Microsoft, ExxonMobil, Johnson & Johnson, and thousands of smaller firms. If one company collapses, your portfolio barely flinches.
Second, they eliminate stock-picking risk. Research from S&P Dow Jones Indices shows that 89% of actively managed large-cap funds underperformed the S&P 500 over the fifteen years ending in 2023. Fund managers with Ivy League credentials, teams of analysts, and proprietary models could not consistently beat a simple index. Individual investors without those resources face even longer odds.
Third, they cost almost nothing. The average actively managed equity fund charges 0.68% annually. That gap compounds brutally: $10,000 invested at 10% gross returns becomes $67,275 after twenty years with a 0.04% fee. The same investment with a 0.68% fee grows to only $62,062. You surrender $5,213 for no additional value.
Start with a U.S. total market fund if you want simplicity. Add an international index fund—such as Vanguard's Total International Stock Index (VTIAX)—if you want geographic diversification. The global economy is interconnected, but country-specific returns diverge year to year. The MSCI EACI Index, which tracks developed markets outside North America, outpaced the S&P 500 during eleven calendar years since 2000 and lagged during thirteen.

How Much Money You Actually Need to Begin
The barrier to entry has collapsed. Fidelity, Charles Schwab, and Vanguard allow you to open brokerage accounts with zero minimum deposits. Schwab's S&P 500 Index Fund (SWPPX) requires no minimum investment. Vanguard's equivalent (VFIAX) requires $3,000 for investor shares, but its ETF version (VOO) trades for roughly $400 per share and accepts fractional purchases through most brokers.
Micro-investing apps like Betterment and Wealthfront let you start with $10. Robinhood and SoFi eliminated account minimums and trading commissions in 2019, triggering an industry-wide race to zero fees. Acorns rounds up debit card purchases to the nearest dollar and invests the spare change automatically.
The practical floor is higher than the legal one. Transaction costs, even at zero commissions, include bid-ask spreads—the difference between buying and selling prices. For liquid ETFs like VOO, that spread is typically one cent per share. For thinly traded funds, it can exceed 0.5%. If you invest $50 across five positions, those spreads and potential rebalancing frictions erode returns disproportionately.
A more realistic starting point is $500 to $1,000. That sum allows you to build a two- or three-fund portfolio without excess friction. It also represents enough capital to make percentage returns meaningful. A 10% annual gain on $50 is $5. The same return on $1,000 is $100. The psychological reinforcement matters during the early months when habits form. When considering the best way to invest 10k, these principles scale proportionally.
Do not wait until you have $10,000. Delaying costs more than small-balance inefficiencies. If you save $200 per month and invest immediately at an 8% average return, you accumulate $29,647 after ten years. If you hoard cash for two years before investing, you end up with $26,483. The difference—$3,164—comes entirely from the compounding you missed.
Setting a Risk Budget That Prevents Panic Selling
Volatility will test your conviction. The S&P 500 fell 33.9% from February to March 2020. It dropped 56.8% from October 2007 to March 2009. It declined 48.2% during the dot-com crash from March 2000 to October 2002. Every one of those declines reversed. Investors who held through the drawdowns not only recovered but posted gains. Those who sold locked in permanent losses.
Your risk tolerance depends on two variables: time horizon and cash reserves. If you will not need the invested capital for twenty years, short-term volatility is irrelevant. A 30% decline followed by a recovery over eighteen months is noise in a multi-decade compounding curve. If you might need the money within two years, stocks are too risky. The probability of a negative return over any single calendar year is roughly 27%, based on historical frequency.
A standard guideline allocates your age as a percentage to bonds. A 25-year-old holds 25% bonds and 75% stocks. A 55-year-old holds 55% bonds and 45% stocks. This formula is blunt but functional. Bonds dampen volatility and provide income, though their returns lag equities over long periods. The Bloomberg U.S. Aggregate Bond Index returned 4.2% annually from 1976 through 2023, compared to 11.4% for the S&P 500.
More precise allocation requires calculating your emergency reserves. Financial planners recommend three to six months of living expenses in cash or cash equivalents. If your monthly expenses are $3,000, you need $9,000 to $18,000 in a high-yield savings account or money market fund before investing aggressively. That buffer prevents forced liquidations during market downturns or personal emergencies.
Once reserves are funded, invest new savings systematically. Automated monthly transfers from checking to brokerage eliminate timing decisions. Vanguard research covering data from 2000 to 2017 found that lump-sum investing outperformed dollar-cost averaging two-thirds of the time, because markets trend upward more often than downward. But dollar-cost averaging delivers psychological benefits: it smooths entry prices and removes the paralysis of waiting for the "right" moment.
The Expensive Mistakes Beginners Make Repeatedly
Overtrading ranks first. A 2019 study by the University of California analyzed 1.6 million accounts at a major discount brokerage. Investors who traded most frequently—defined as more than ten times per month—underperformed the market by an average of 6.5 percentage points annually. The least active accounts, rebalanced once or twice per year, matched or exceeded benchmark returns. Every trade incurs spreads, potential taxes on gains, and the risk of poor timing.
Chasing performance ranks second. Morningstar's Mind the Gap study measures the difference between fund returns and investor returns. Equity fund investors lagged their funds by an average of 1.7 percentage points annually from 2003 to 2022, because they bought after strong years and sold after weak ones. The pattern is mechanical: funds that returned 30% in year one attracted huge inflows in year two, then reverted to mean returns or declined. Investors entered at peaks and exited at troughs.
Ignoring fees ranks third. A 1% annual expense ratio seems trivial, but it compounds against you. The SEC's mutual fund cost calculator shows that a $10,000 investment with 6% annual returns and a 1% fee grows to $28,213 after twenty years. The same investment with a 0.1% fee grows to $31,848. The difference—$3,635—represents 36% of your initial capital. High fees are almost impossible to overcome through superior stock selection, especially after taxes.
Underdiversification ranks fourth. Concentrated bets on individual stocks or narrow sectors amplify risk without proportional return. The Russell 3000 Index tracks 98% of the U.S. equity market. Between 1995 and 2020, 56% of individual stocks underperformed Treasury bills. A mere 4% of companies accounted for all net wealth creation in the market. Picking the winners in advance is statistically improbable for professionals and nearly impossible for beginners.
Emotional selling ranks fifth. Behavioral finance research by Terrance Odean and Brad Barber shows that individual investors sell winning positions too early to lock in gains and hold losing positions too long to avoid realizing losses. This disposition effect destroys compounding. If you bought Amazon at $100, watched it fall to $70, then sold at $90 to "minimize losses," you missed the subsequent climb to $3,500. Disciplined rebalancing based on target allocations prevents this error.
Building a Portfolio That Requires Minimal Maintenance
A three-fund portfolio covers global equities and bonds with minimal overlap. The structure is simple: a U.S. total stock market fund, an international total stock market fund, and a U.S. total bond market fund. Adjust the percentages based on risk tolerance. A 70/20/10 split allocates 70% to U.S. stocks, 20% to international stocks, and 10% to bonds. A 50/20/30 split lowers equity exposure for investors nearing retirement.
Rebalance once per year or when any position drifts more than five percentage points from its target. If your 70% U.S. stock allocation grows to 76% due to strong performance, sell 6% and redistribute to the lagging positions. This forces you to buy low and sell high automatically. Vanguard's research from 1926 to 2019 found that annual rebalancing added 0.35 percentage points to returns compared to no rebalancing, while monthly rebalancing added no incremental benefit and increased transaction costs.
Tax-advantaged accounts should be your first destination. A Roth IRA allows after-tax contributions up to $7,000 annually for those under 50. Earnings grow tax-free, and qualified withdrawals after age 59½ incur no taxes. Traditional IRAs and 401(k)s allow pre-tax contributions, reducing your taxable income today. Employer 401(k) matches are free money: if your company matches 50% of contributions up to 6% of salary, you earn an instant 50% return on that portion.
Max out employer matches before opening taxable brokerage accounts. The tax drag on taxable accounts averages 1.0 to 1.5 percentage points annually for equity funds, due to dividend taxes and capital gains on distributions. That penalty compounds over decades. A $10,000 investment at 8% pre-tax returns becomes $46,610 after twenty years in a Roth IRA. The same investment in a taxable account, assuming a 15% capital gains rate and annual distributions, grows to approximately $40,800. For those pursuing income investing, tax-advantaged accounts maximize after-tax returns.
Target-date funds simplify allocation for hands-off investors. Vanguard's Target Retirement 2060 Fund (VTTSX) holds roughly 90% stocks and 10% bonds, then gradually shifts toward bonds as 2060 approaches. The glide path is formulaic, but it removes emotional rebalancing decisions. Expense ratios for target-date funds range from 0.08% at Vanguard to 0.65% at some actively managed providers. The internal composition matters less than the cost.
Learning Resources That Deliver Practical Value
William Bernstein's "The Four Pillars of Investing" explains asset allocation, market history, and behavioral finance without jargon. Burton Malkiel's "A Random Walk Down Wall Street" demonstrates why passive indexing outperforms active management. John Bogle's "The Little Book of Common Sense Investing" delivers the case for low-cost index funds in 200 pages.
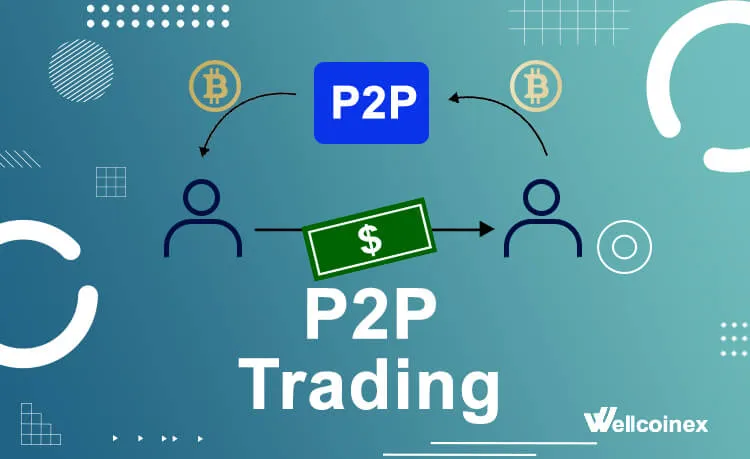
The Bogleheads forum hosts thousands of threads on portfolio construction, tax optimization, and fund comparisons. Users share real account data and specific strategies. The community enforces evidence-based advice and dismisses speculation. Reddit's r/Bogleheads subreddit serves a similar function with faster response times. For those exploring alternative investment through P2P trading, specialized forums provide additional perspectives.
The SEC's Investor.gov site offers free tools, including a mutual fund cost calculator and glossary of investment terms. FINRA's Fund Analyzer compares expense ratios and past performance across 18,000 mutual funds and ETFs. Morningstar's free tier provides basic fund data, holdings, and style-box classifications.
Podcasts like "Rational Reminder" and "Animal Spirits"
