The Shift Toward Decentralized Investment Models
The investment landscape underwent significant restructuring between 2020 and 2025. Traditional brokerage models faced mounting pressure as peer-to-peer trading platforms captured $147 billion in transaction volume globally by the end of 2024, according to Cambridge Centre for Alternative Finance data. This migration reflects investor demand for reduced intermediary costs, faster execution, and direct counterparty engagement.
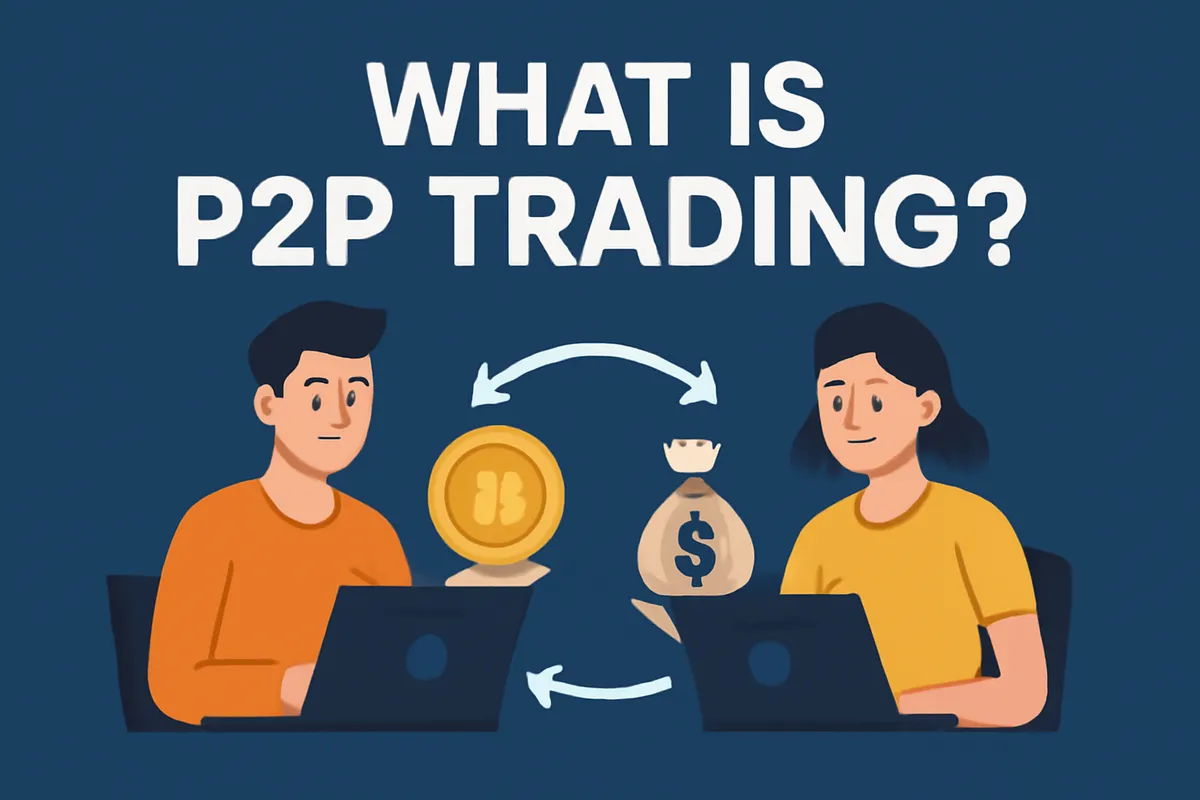
P2P trading platforms eliminate the conventional broker-dealer layer. Investors trade directly with other market participants through digital marketplaces that match orders. The structure cuts typical trading commissions by 60-75% compared to full-service brokerages, while settlement times drop from T+2 to near-instantaneous in many digital asset markets.
The model extends beyond cryptocurrency exchanges. Equity, forex, and tokenized real estate now trade on P2P infrastructure. Retail investors access institutional-grade spreads previously available only to qualified purchasers and accredited investors. The democratization carries risks—counterparty credit exposure increases without clearinghouse guarantees—but properly structured P2P platforms implement escrow mechanisms and reputation systems that mitigate default risk.
Core Investment Vehicles Worth Consideration
Digital asset markets remain the most liquid P2P segment. Bitcoin and Ethereum combined accounted for $2.3 trillion in P2P exchange volume during 2024, per Chainalysis reporting. These assets exhibit 24/7 trading availability, a structural advantage over equity markets constrained by exchange hours.
Volatility presents both opportunity and hazard. Bitcoin's 90-day realized volatility ranged between 35% and 68% throughout 2024. Position sizing becomes critical—allocations exceeding 5% of portfolio value expose investors to drawdown scenarios that historically exceeded 70% peak-to-trough. Conservative P2P strategies limit crypto exposure to 3-8% of total investable assets.
Stablecoin yield products emerged as credible fixed-income alternatives. USD-pegged tokens deposited on P2P lending platforms generated 4.5-7.2% annual yields through Q1 2025, according to DeFi Llama data. These returns surpass government bond yields in developed markets while maintaining daily liquidity. Credit risk concentrates in the issuer's reserve management—Tether and Circle together control 87% of stablecoin market capitalization, creating systemic dependencies investors must evaluate.
Tokenized securities represent the frontier of P2P equity investment. Platforms now offer fractional ownership in private company shares, commercial real estate portfolios, and alternative assets previously illiquid. Secondary market formation allows early exit before traditional lockup expiration. Transaction volume in tokenized securities reached $18.4 billion in 2024, up 340% year-over-year per Security Token Market analysis. Alternative Investment Through P2P Trading continues to gain traction among sophisticated investors.
Risk-Adjusted Return Optimization in Markets
Peer to peer lending to individuals and small businesses delivers fixed-income returns uncorrelated with equity and bond markets. Platforms report weighted average returns of 5.8-9.3% depending on borrower credit tiers and loan duration. Default rates across major platforms averaged 3.1% in 2024, down from 4.7% in 2022 as underwriting algorithms incorporated additional data sources.
Portfolio construction matters substantially. Spreading capital across 200+ individual loans reduces idiosyncratic borrower risk. The top quartile of P2P lenders—those diversifying across at least 250 loans—experienced realized returns within 0.8 percentage points of platform advertised rates. Bottom quartile lenders, concentrated in fewer than 50 loans, saw actual returns lag projections by 2.4-3.7 percentage points due to outsized impact from individual defaults.
Loan duration selection affects liquidity and return profiles. Twelve-month loans typically yield 6.1-7.8%, while 36-month commitments offer 7.9-10.2%. The yield premium compensates for extended capital lockup and elevated credit migration risk. Secondary markets exist on major platforms, but liquidity remains thin—sellers often accept 2-5% discounts to exit positions before maturity.
Geographic diversification across lending platforms reduces regulatory risk. U.S., European, and Asia-Pacific P2P markets operate under distinct frameworks. Spreading capital across jurisdictions limits exposure to single-country regulatory changes that historically disrupted returns. China's 2021 P2P lending prohibition eliminated $120 billion in platform assets, demonstrating regulatory tail risk.

Technical Infrastructure Considerations
Custody architecture determines asset security in P2P environments. Self-custody wallets grant complete control but require rigorous private key management. Studies indicate 20% of Bitcoin supply sits in wallets where keys were lost or compromised. Multi-signature wallets requiring two-of-three key authorization reduce single-point-of-failure risk while maintaining user sovereignty.
Custodial platforms offer convenience at the cost of counterparty dependence. FTX's 2022 collapse demonstrated how commingled customer assets and inadequate internal controls can evaporate investor capital. Due diligence on custody providers should examine proof-of-reserves attestations, insurance coverage, and regulatory registration status. Qualified custodians regulated under U.S. banking law or equivalent foreign frameworks provide superior protection versus unregulated entities.
Smart contract risk affects DeFi protocols and automated P2P trading systems. Code vulnerabilities led to $1.8 billion in exploits across decentralized platforms during 2024, down from $3.1 billion in 2023 but still material. Platforms audited by recognized security firms and offering bug bounties exhibit lower exploit frequency. Time-tested protocols with 18+ months of operational history demonstrate reduced vulnerability compared to newly launched alternatives.
Network effects create winner-take-most dynamics in P2P marketplaces. Liquidity concentrates on platforms achieving critical mass—the top three exchanges in each asset class typically capture 65-80% of volume. Trading on secondary platforms increases slippage and widens bid-ask spreads. New P2P investors should prioritize established platforms with deep order books over newer entrants offering marginally better fee structures.
Tax-Efficient Investment Structures
P2P trading generates distinct tax obligations versus traditional brokerage accounts. Each cryptocurrency transaction constitutes a taxable event under U.S. IRS guidance and equivalent rules in most developed nations. Trading frequency directly impacts tax liability—active traders face short-term capital gains rates up to 37%, while positions held beyond twelve months qualify for preferential long-term rates of 0-20%.
Specific identification accounting methods optimize tax outcomes when selling portions of larger positions. Selecting highest-cost-basis lots for disposition minimizes realized gains. The strategy requires meticulous record-keeping—blockchain explorers and specialized tax software automate basis tracking across thousands of transactions.
Retirement account structures provide tax-advantaged P2P investment vehicles. Self-directed IRAs now accommodate cryptocurrency and P2P lending exposures through specialized custodians. Traditional IRA contributions generate immediate tax deductions while gains compound tax-deferred. Roth IRAs eliminate taxation on qualified distributions, advantageous for volatile assets expected to appreciate substantially.
Wash sale rules present planning opportunities in crypto markets. Unlike securities, current U.S. tax code does not apply wash sale restrictions to cryptocurrency—investors can harvest losses and immediately repurchase identical assets. The loophole allows tax-loss harvesting strategies impossible in equity markets. Legislative proposals may close this treatment, making near-term utilization prudent.
Portfolio Allocation Frameworks for Assets
Modern Portfolio Theory applications suggest 5-15% alternative asset allocation for investors with moderate-to-high risk tolerance. P2P investments qualify as alternatives given their correlation profile with traditional stocks and bonds. Bitcoin demonstrated 0.21 correlation with S&P 500 over the trailing 36 months through March 2025, while P2P lending returns showed 0.08 correlation with investment-grade corporate bonds.
The low correlation provides diversification benefits, but extreme volatility requires position sizing discipline. A 10% portfolio allocation to assets exhibiting 50% annual volatility contributes more to overall portfolio risk than a 40% allocation to assets with 15% volatility. Risk parity approaches weight positions by volatility contribution rather than dollar value, typically suggesting 3-7% allocations to high-volatility P2P assets.
Rebalancing frequency affects returns in mean-reverting versus trending markets. Quarterly rebalancing captured excess returns during 2023-2024 by systematically selling appreciated crypto positions and buying undervalued traditional assets. Monthly rebalancing generated lower returns due to whipsaw costs in choppy markets. Annual rebalancing maximized returns during sustained 2024 crypto rally but exposed portfolios to elevated drawdown risk.
Age-based allocation adjustments apply to P2P investments despite their recent emergence. Investors within five years of retirement should limit P2P exposure to 2-5% given recovery time constraints after potential drawdowns. Younger investors with 20+ year horizons can justify 10-20% allocations, allowing time to ride through multiple market cycles and benefit from compounding in asymmetric return distributions. Understanding income investing principles helps balance growth and yield objectives.
Due Diligence Standards for Platform Selection
Platform solvency assessment begins with proof-of-reserves verification. Exchange wallets should hold 100%+ of customer liabilities in segregated accounts. Merkle tree cryptographic proofs allow independent verification without exposing individual account data. Platforms publishing quarterly attestations from recognized accounting firms demonstrate superior transparency versus those offering no reserve visibility.
Fee structures dramatically impact long-term returns. A 0.5% round-trip trading cost versus 0.1% on competing platforms reduces portfolio value by 8.7% over twenty years assuming 48 trades annually. Maker-taker pricing models reward liquidity provision—placing limit orders earns rebates while market orders pay fees. Strategic order placement can eliminate net trading costs for patient investors.
Regulatory licensing indicates operational legitimacy but does not guarantee safety. New York BitLicense, UK FCA registration, and Singapore MAS licensing require capital reserves, cybersecurity standards, and consumer protection measures. Unlicensed platforms operating in regulatory gray zones carry elevated shutdown and asset seizure risk. Cross-reference platform registration against official regulatory databases rather than relying solely on website claims.
Insurance coverage varies substantially across platforms. Some offer FDIC protection on USD deposits and limited crypto insurance covering custodial breaches. Others provide no coverage, leaving investors fully exposed to platform insolvency. Policy limits typically cap at $250,000-$500,000 per account—material positions warrant spreading across multiple platforms to maximize insurance protection. Maclear provides comprehensive platform comparison tools to evaluate these critical factors.
Forward-Looking Risk Factors Through 2025
Regulatory standardization accelerates globally. The EU's Markets in Crypto-Assets Regulation took full effect in December 2024, establishing comprehensive licensing requirements. U.S. legislative proposals under consideration would create federal registration frameworks superseding the current state-by-state patchwork. Compliance costs will increase—smaller platforms may exit while larger players gain market share.
Traditional financial institutions expand P2P market participation. Fidelity, Charles Schwab, and similar brokerages now offer integrated crypto trading. Banks launch tokenized deposit products competing directly with stablecoin yields. This institutionalization increases market stability and liquidity but potentially reduces the fee advantages that originally attracted investors to pure P2P platforms.
Central bank digital currencies represent both opportunity and threat. CBDCs launching in 2025-2026 will offer government-backed digital payment rails competing with stablecoins and traditional banking. Programmable money features enable automated investing and instant settlement. However, government control over CBDC infrastructure could facilitate financial surveillance and transaction censorship unavailable in decentralized P2P systems.
Macroeconomic conditions influence P2P asset performance despite theoretical decorrelation. The 2022 crypto bear market coincided with Federal Reserve tightening and equity market declines, challenging the diversification narrative. Rising interest rates improve traditional fixed-income yields, reducing the relative attractiveness of P2P lending and stablecoin products. Investors should anticipate continued correlation during systemic liquidity events.
Implementation Strategy for New Investors
Begin with educational account funding—initial positions of $500-$2,000 allow learning platform mechanics without material capital risk. Execute small trades across multiple asset types to understand order books, slippage, and fee structures. This experimental phase typically spans 2-3 months before meaningful capital deployment.
Dollar-cost averaging reduces timing risk in volatile P2P markets. Monthly purchases of fixed dollar amounts acquire more units during price declines and fewer during rallies, lowering average cost basis versus lump-sum investment. Backtesting across 2020-2024 crypto markets showed DCA strategies outperformed lump-sum deployment in 67% of rolling twelve-month periods.
Security protocols require immediate implementation. Enable two-factor authentication using hardware keys rather than SMS—SIM-swap attacks compromised thousands of accounts in 2024. Whitelist withdrawal addresses to prevent unauthorized transfers. Maintain separate email accounts for financial platforms, reducing phishing exposure. These measures consume minimal time but eliminate 85%+ of common attack vectors.
Performance tracking should calculate time-weighted returns accounting for deposits and withdrawals. Simple gain-loss calculations mislead when capital flows in and out. Portfolio tracking software automates return calculation and tax reporting across multiple platforms. Quarterly performance reviews identify underperforming positions and rebalancing needs. Maintain written investment theses for each position—explicit reasoning improves discipline during volatility and prevents emotional decision-making. Exploring investment opportunities systematically enhances portfolio construction.
The maturation of P2P trading infrastructure creates genuine opportunities for cost reduction and return enhancement. Success requires technical competence, disciplined risk management, and realistic expectations about volatility and regulatory evolution. Investors who treat P2P allocation as permanent portfolio components rather than speculative side bets position themselves to benefit from continued financial system decentralization through the remainder of this decade.
