Understanding the Core Mechanics of Investing
Investing transforms cash into ownership stakes or debt agreements that can generate returns over time. When you invest $1,000 in a company's stock, that money doesn't sit in a vault with your name on it. The company uses those funds to expand operations, develop products, or pay down debt. In exchange, you receive shares representing fractional ownership and the right to participate in future profits.
The financial markets operate as intermediaries connecting capital providers with capital users. Businesses need funding to grow. Governments need money to build infrastructure. Investors need places to put money where it outpaces inflation. This exchange creates the foundation of modern investing.
Your money follows specific paths depending on the investment vehicle. Stock purchases typically happen on secondary markets—exchanges where existing shares trade hands. The company already received the capital during its initial public offering. Your purchase price goes to the previous shareholder, not the company directly. Yet the stock's market price still matters to the company. Higher valuations enable cheaper borrowing and attract talent through stock compensation.
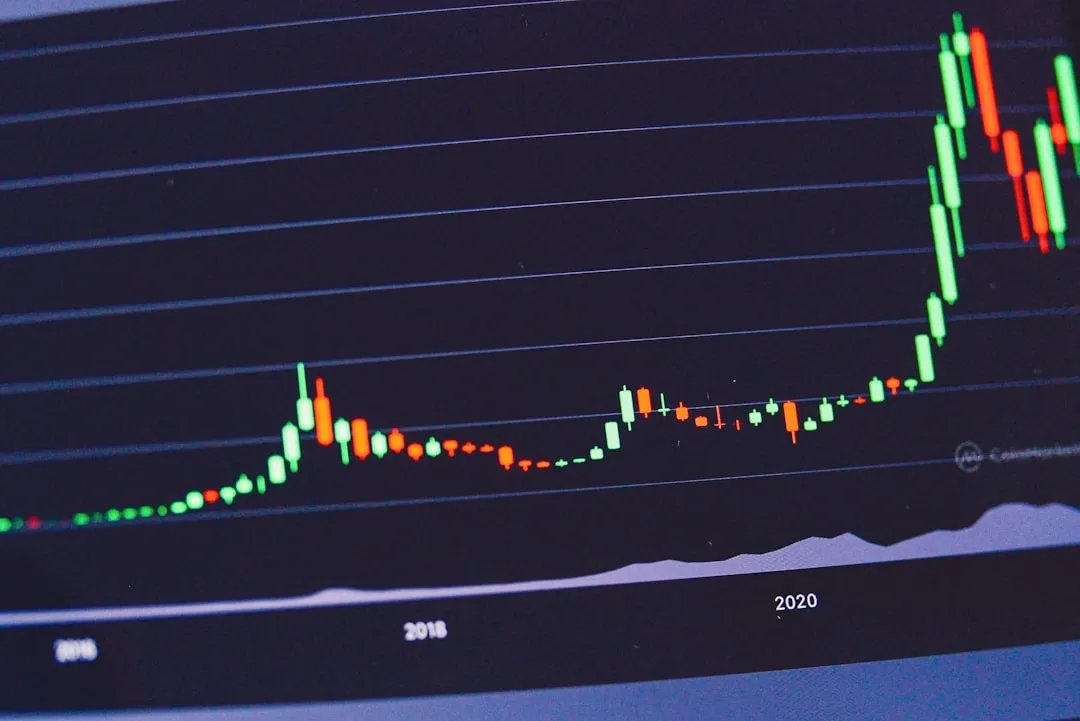
Primary Investment Categories and Their Function
Stocks represent equity ownership. Buying 100 shares of a company with 10 million outstanding shares gives you 0.001% ownership. This entitles you to 0.001% of distributed profits and voting rights at shareholder meetings. Stock values fluctuate based on earnings reports, industry trends, management decisions, and broader economic conditions. The S&P 500 has delivered approximately 10% average annual returns since 1926, though individual years swing dramatically higher or lower.
Bonds function as loans to entities needing capital. Purchase a $10,000 corporate bond with a 5% coupon and 10-year maturity, and the issuer pays you $500 annually for a decade, then returns your $10,000 principal. Bond prices move inversely to interest rates. When new bonds offer 6% yields, your 5% bond becomes less attractive, reducing its market value. Default risk separates bond categories—U.S. Treasury bonds carry minimal risk, while high-yield corporate bonds offer higher rates to compensate for elevated default probability.
Mutual funds and exchange-traded funds pool investor capital to purchase diversified portfolios. A mutual fund might hold 200 different stocks, giving a $5,000 investment exposure to all 200 companies. Fund managers charge expense ratios—typically 0.05% to 1.5% annually—to cover operations and management. Index funds tracking market benchmarks charge lower fees than actively managed funds attempting to beat market returns.
Real estate investment operates through direct property ownership or real estate investment trusts (REITs). Direct ownership requires substantial capital and management effort. REITs bundle properties into tradable securities, distributing 90% of taxable income to shareholders to maintain tax advantages. Commercial real estate has produced 9.5% average annual returns over the past 20 years, according to NCREIF data.
The Mathematics Behind Investment Returns
Compounding drives long-term wealth accumulation. A $10,000 investment growing at 8% annually reaches $21,589 after 10 years. That same investment held for 30 years grows to $100,627. The difference—$79,038 versus $11,589 in the first decade—illustrates why starting early matters more than perfect timing.
Returns consist of two components: capital appreciation and income. Capital appreciation occurs when assets increase in value. A stock purchased at $50 and sold at $75 generates $25 in capital gains. Income investing arrives through dividends, bond interest, or rental payments. Total return combines both elements. A stock rising from $50 to $55 while paying $2 in dividends delivers 14% total return: $5 capital gain plus $2 dividend divided by $50 initial investment.
Volatility measures return variability. Standard deviation quantifies how much returns deviate from averages. The stock market shows approximately 15% annual standard deviation. This means in roughly two-thirds of years, returns fall within 15 percentage points of the historical average. One in six years produces returns outside this range in either direction.
Risk-adjusted returns account for volatility. An investment gaining 12% with 20% volatility may be less attractive than one gaining 10% with 8% volatility. The Sharpe ratio calculates excess return per unit of risk, helping compare dissimilar investments.

Asset Allocation and Portfolio Construction
Portfolio composition determines 90% of return variation over time, according to research by Brinson, Hood, and Beebower. Security selection and market timing contribute less than many investors assume. A portfolio holding 60% stocks and 40% bonds will behave similarly to market benchmarks for those asset classes, regardless of which specific stocks or bonds it contains.
Age-based allocation follows the principle that younger investors can accept more volatility because time allows recovery from downturns. The traditional formula suggests holding bonds equal to your age percentage—a 30-year-old holds 30% bonds and 70% stocks. Target-date funds automate this approach, gradually reducing equity exposure as retirement approaches.
Diversification reduces unsystematic risk—the danger specific to individual companies or sectors. Holding 20-30 stocks across different industries eliminates most company-specific risk. International exposure adds another diversification layer. When U.S. markets decline, foreign markets don't always follow. Between 2000 and 2009, international stocks outperformed U.S. equities. From 2010 to 2019, U.S. stocks dominated.
Rebalancing maintains target allocations. When stocks surge, they comprise a larger portfolio percentage than intended. Selling winners and buying laggards feels counterintuitive but enforces buying low and selling high. Annual rebalancing typically adds 0.4% to 0.8% in risk-adjusted returns.
Investment Account Structures and Tax Treatment
Taxable brokerage accounts offer complete flexibility. Deposit and withdraw funds without restriction. Pay taxes on dividends and interest the year received. Capital gains face taxation only when realized through sales. Long-term capital gains—assets held over one year—receive preferential rates of 0%, 15%, or 20% depending on income, substantially lower than ordinary income rates reaching 37%.
401(k) plans allow pre-tax contributions up to $23,000 annually for 2024, plus $7,500 catch-up contributions for those 50 and older. Contributions reduce current taxable income. Investments grow tax-deferred. Withdrawals in retirement face ordinary income tax. Many employers match contributions up to certain percentages—typically 50% to 100% of the first 3% to 6% contributed. This represents guaranteed returns exceeding any market investment.
Individual Retirement Accounts come in traditional and Roth varieties. Traditional IRAs function like 401(k)s—pre-tax contributions, tax-deferred growth, taxed withdrawals. Roth IRAs reverse this: after-tax contributions, tax-free growth, tax-free qualified withdrawals. Annual contribution limits reach $7,000 for 2024, plus $1,000 for those 50 and older. High earners face Roth eligibility restrictions, though backdoor conversion strategies exist.
Health Savings Accounts provide triple tax advantages for those with high-deductible health plans. Contributions are pre-tax, growth is tax-free, and withdrawals for qualified medical expenses face no taxes. After age 65, non-medical withdrawals function like traditional IRA distributions. Maximum contributions for 2024 reach $4,150 for individuals and $8,300 for families.

Market Orders and Trade Execution
Market orders execute immediately at the best available price. Submit a market order to buy 50 shares, and the system matches you with the nearest seller. You receive instant execution but uncertain pricing. In volatile markets, the final price may differ from the quoted price you saw.
Limit orders specify maximum purchase prices or minimum sale prices. A limit order to buy at $50 only executes at $50 or less. This guarantees price but not execution. The stock might never reach your target, leaving the order unfilled.
Stop-loss orders trigger market orders when stocks hit specified prices. Set a stop-loss at $45 on a stock currently trading at $50, and the system automatically sells if the price drops to $45, limiting potential losses. Stop-limit orders combine features, triggering limit orders rather than market orders at the stop price.
Bid-ask spreads represent the gap between highest buyer offers and lowest seller asks. Highly traded stocks show spreads of one cent. Thinly traded securities might show spreads of several percentage points. You always buy at the ask and sell at the bid, meaning spreads create immediate small losses on round-trip trades.
Common Investment Strategies for Different Goals
Index investing matches market returns through broad index funds. Rather than selecting individual stocks, investors buy funds tracking the S&P 500, total stock market, or total bond market. This approach guarantees average market returns minus minimal fees. Since 85% of active fund managers underperform their benchmarks over 15-year periods, index investing delivers superior results for most investors.
Dollar-cost averaging invests fixed amounts at regular intervals regardless of market conditions. Investing $500 monthly buys more shares when prices are low and fewer when prices are high. This reduces timing risk and eliminates the emotional difficulty of investing lump sums during market peaks. Research shows lump-sum investing produces higher returns approximately 66% of the time, but dollar-cost averaging reduces regret and stress.
Value investing identifies underpriced securities trading below intrinsic value. Metrics like price-to-earnings ratios, price-to-book ratios, and dividend yields help identify candidates. Value stocks tend to underperform during bull markets but provide downside protection during corrections. Over complete market cycles, value approaches have historically matched or exceeded growth stock returns.
Dividend growth investing focuses on companies consistently increasing dividend payments. These companies typically demonstrate stable business models and strong cash flow. Dividend aristocrats—S&P 500 companies raising dividends for 25+ consecutive years—number approximately 65. Reinvested dividends compound wealth substantially. From 1970 to 2020, reinvested dividends comprised roughly 84% of total stock market returns.
Investment Costs and Their Impact
Expense ratios compound like returns in reverse. A fund charging 1% annually reduces a $100,000 portfolio by $1,000 the first year. At 7% annual growth, that portfolio reaches $574,000 after 30 years. The same portfolio in a fund charging 0.10% grows to $735,000—a $161,000 difference from a seemingly small fee variation.
Trading commissions have largely disappeared at major brokers. Most now offer zero-commission stock and ETF trades. Options trades typically cost $0.50 to $0.65 per contract. Mutual funds may charge front-end loads, back-end loads, or both. No-load funds carry no sales charges, making them preferable for most investors. When evaluating best investment platforms, fee structures remain a critical consideration.
Tax costs often exceed visible fees. Actively managed funds generate capital gains distributions when managers sell appreciated holdings. Shareholders pay taxes on these distributions even if they reinvested proceeds and sold nothing personally. Index funds generate minimal capital gains because they rarely trade holdings.
Risk Management and Loss Prevention
Position sizing limits damage from individual investment failures. Never allocating more than 5% of a portfolio to any single stock prevents catastrophic losses. Even excellent research cannot eliminate company-specific disasters. Enron, Lehman Brothers, and dozens of seemingly stable companies have collapsed unexpectedly.
Emergency funds prevent forced selling during downturns. Maintaining 6-12 months of expenses in high-yield savings accounts ensures market positions can remain intact when jobs disappear or major expenses arise. Selling stocks during bear markets locks in losses and sacrifices future recovery gains. Maclear provides tools to help investors manage risk across diverse portfolios.
Time horizon matching aligns investment risk with planned usage. Money needed within five years belongs in safe investment options—savings accounts, CDs, short-term bonds. Long-term funds can accept volatility because decades of compounding override short-term fluctuations. The stock market has never produced negative returns over any 20-year period since 1926.
Avoiding behavioral mistakes preserves capital. Panic selling during crashes, chasing hot stocks, and timing the market destroy returns. Dalbar studies consistently show individual investors earn 3-4 percentage points less than mutual fund returns they own, purely due to poor timing of purchases and sales. Discipline and planning overcome instinct and emotion in successful investing.
