Understanding P2P Crowdlending Infrastructure
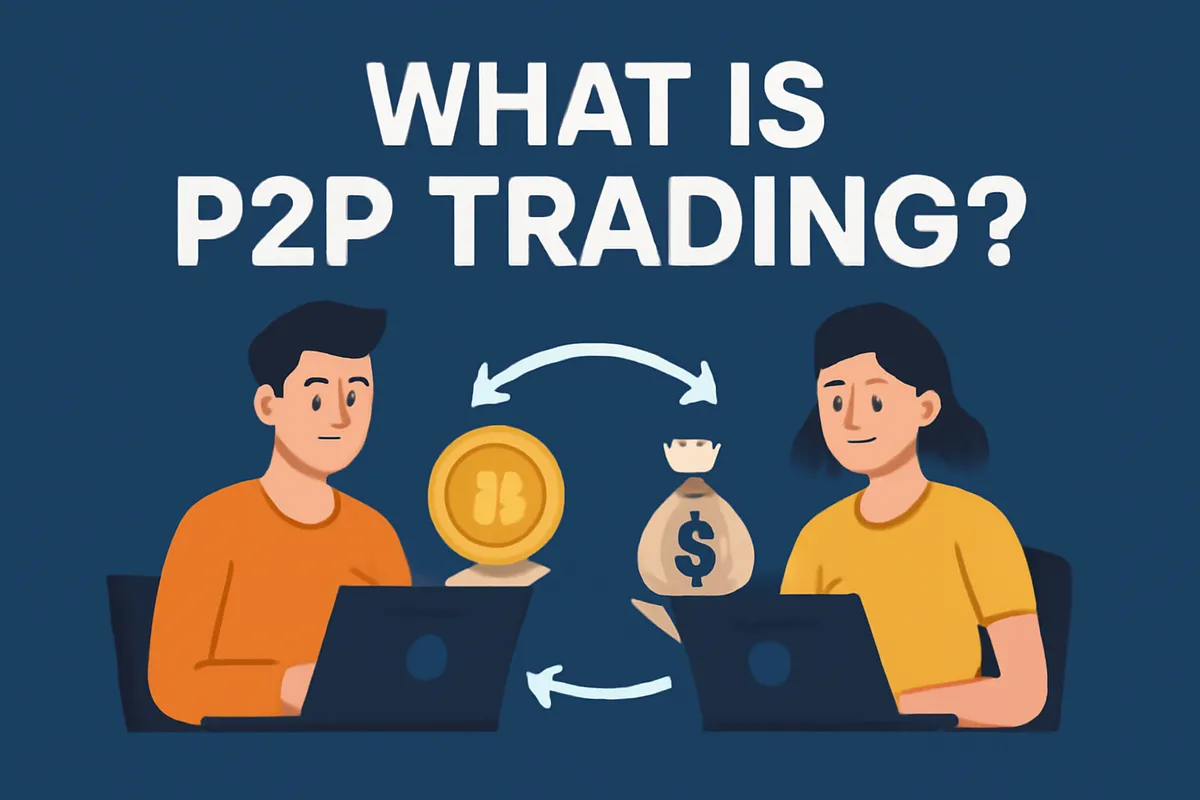
P2P crowdlending platforms connect borrowers directly with individual lenders through digital marketplaces. These platforms eliminate traditional financial intermediaries, allowing capital to flow from savers to borrowers at rates more favorable than conventional bank products. The model emerged after the 2008 financial crisis when tightened bank lending created market gaps for both consumer and business credit.
Platform operators handle credit assessment, loan origination, payment processing, and collections. Most charge borrowers origination fees ranging from 1% to 5% of loan value, while lenders pay annual servicing fees between 0.5% and 1.5% of outstanding principal. This fee structure keeps operational costs below traditional banking overhead while maintaining loan quality standards.
The technology stack behind these platforms processes thousands of data points per application. Automated underwriting systems analyze credit scores, bank statements, employment records, and alternative data sources. Machine learning models price risk more granularly than traditional FICO-based approaches, often approving creditworthy applicants rejected by banks while accurately identifying high-risk profiles.
Modern platforms typically process loan decisions within 24 to 48 hours. Approved borrowers receive funds in 3 to 7 business days on average. This speed advantage stems from automated workflows and streamlined documentation requirements compared to bank processes that can take weeks or months.
Market Size and Growth Trajectory
Global peer to peer lending volume reached $132 billion in 2022, representing 12% annual growth over the previous five years. North American platforms originated $61 billion in loans during 2022, while European markets generated $43 billion and Asian platforms $28 billion. These figures reflect growing mainstream adoption beyond early-adopter segments.
The United States hosts the largest single market with $57 billion in annual originations. LendingClub, Prosper, and Funding Circle dominate domestic consumer and small business segments respectively. United Kingdom platforms processed $18 billion in 2022, led by established operators that pioneered regulatory frameworks adopted across Europe.
China previously commanded the largest market share before regulatory interventions reduced platform counts from over 6,000 in 2015 to fewer than 30 licensed operators by 2023. Despite this contraction, Chinese platforms still facilitate substantial loan volumes under stricter supervision frameworks.
Default rates vary significantly by loan grade and platform. Prime consumer loans typically show 2% to 4% annual default rates, while subprime segments reach 8% to 15%. Small business loans carry higher risk with default rates between 6% and 20% depending on industry sector and loan term. These figures compare favorably to historical bank default rates in similar credit segments.
Borrower Use Cases and Advantages
Consumer borrowers access p2p crowdlending primarily for debt consolidation, representing 58% of all personal loan applications according to platform data. Credit card refinancing offers immediate interest savings when borrowers replace 18% to 24% APR balances with p2p loans at 7% to 14% rates. A borrower consolidating $15,000 in credit card debt saves approximately $2,400 in annual interest expense at these rates.
Home improvement projects account for 18% of loan purposes. Borrowers finance renovations at rates below home equity products while avoiding property liens or extended approval timelines. Major expenses like medical procedures, weddings, or vehicle purchases represent another 12% of applications.
Small business owners use crowdlending when traditional bank credit proves inaccessible or too slow. Platforms approve 38% of small business applications compared to 23% approval rates at traditional banks for similar borrower profiles. Speed matters critically for businesses requiring working capital during seasonal peaks or to fulfill large orders. Maclear connects businesses with lenders efficiently through its digital marketplace.
Interest rates fluctuate based on credit profiles. Excellent credit borrowers (FICO 740+) qualify for rates starting at 6.5% to 9.5%, while good credit applicants (660-739) see 10% to 15% rates. Fair credit borrowers (580-659) pay 16% to 25% when approved. These rates undercut credit cards and personal lines of credit for most borrowers.
Loan terms typically span 3 to 5 years for personal loans and 6 to 36 months for business financing. Fixed monthly payments provide budget certainty unlike revolving credit products. Most platforms allow prepayment without penalties, giving borrowers flexibility to retire debt early when cash flow permits.

Lender Return Profiles and Risk Factors
Individual lenders allocate capital across diversified loan portfolios pursuing returns between 4% and 9% annually after defaults and fees. This performance falls between savings account yields (currently 0.5% to 1.5%) and equity market historical returns (approximately 10% annually), offering an intermediate risk-return position.
Platform data shows that lenders spreading capital across 200+ loans reduce volatility substantially compared to concentrated portfolios. A $10,000 investment distributed in $50 increments across 200 loans produces more consistent outcomes than $1,000 positions in 10 loans. Diversification mitigates individual default impact through portfolio effects.
Most platforms offer automated investment tools that allocate capital according to risk preferences and return targets. These algorithms select loans matching specified criteria, reinvest repayments automatically, and maintain target portfolio composition. Manual selection remains available for lenders preferring direct loan evaluation. Understanding income investing principles helps lenders optimize their portfolio strategies.
Tax treatment varies by jurisdiction but generally classifies p2p lending returns as ordinary income rather than capital gains. United States lenders report interest income on Schedule B of tax returns. Some platforms issue 1099-INT forms when annual interest exceeds $10, though lenders must report all income regardless of form receipt.
Secondary markets operate on larger platforms, allowing lenders to sell loan participations before maturity. Liquidity varies based on loan performance and remaining term. Well-performing loans with significant remaining payments trade close to par value, while delinquent loans sell at discounts between 20% and 60% of remaining principal.
Credit Assessment Methodology
Platform underwriting combines traditional credit metrics with alternative data sources. Credit scores provide baseline risk assessment, but employment stability, income verification, debt-to-income ratios, and banking behavior add nuance to automated decisions. Minimum credit scores typically range from 600 to 640 depending on platform risk appetite.
Income verification methods have evolved beyond pay stub uploads. Many platforms now use bank account API connections to verify income deposits, expense patterns, and account balances in real time. This approach reduces documentation burden while improving fraud detection compared to manual document review.
Debt-to-income ratios cap at 40% to 45% for most platforms, though some accept higher ratios for excellent credit borrowers. This metric measures monthly debt payments as a percentage of gross monthly income. A borrower earning $6,000 monthly with $2,000 in existing debt payments shows a 33% ratio, leaving room for additional borrowing.
Alternative data sources increasingly inform credit decisions. Rental payment history, utility bill payments, education credentials, and professional licenses provide signals for thin-file applicants lacking extensive credit histories. These inputs help platforms serve immigrant populations and young professionals underserved by traditional models.
Some platforms incorporate behavioral scoring based on application completion patterns, device usage, and interaction characteristics. Research shows correlations between application behavior and repayment performance, though these methods raise fairness concerns requiring careful validation.
Regulatory Frameworks Across Markets
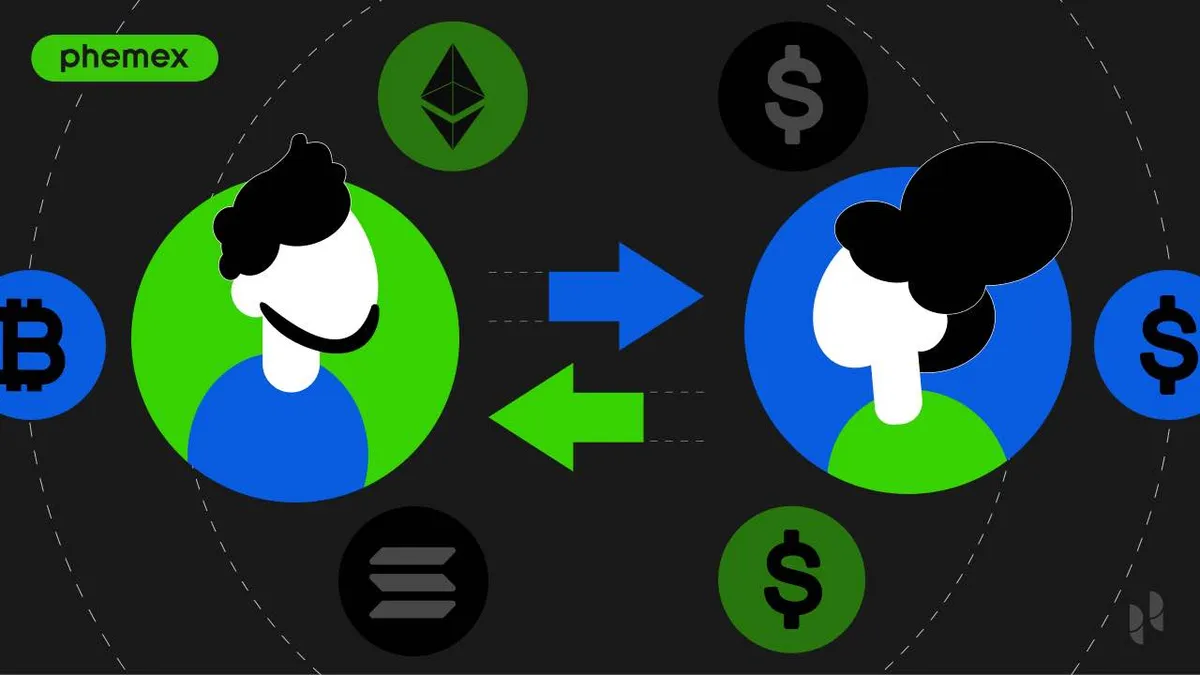
United States regulation varies by state and loan type. Consumer loans under $10,000 may require securities registration depending on state law, while larger commercial loans face fewer restrictions. The Securities and Exchange Commission classifies certain p2p lending notes as securities requiring registration or exemption.
Interest rate caps impose significant constraints in states with strict usury laws. Arkansas, Vermont, and West Virginia cap consumer loan rates below levels many platforms require for profitable operations in higher-risk segments. Platforms often exclude residents of restrictive states from borrowing or lending.
European Union markets operate under diverse national frameworks despite harmonization efforts. United Kingdom regulation requires platform authorization by the Financial Conduct Authority, which supervises loan origination standards, capital adequacy, and consumer protection measures. Platforms must maintain contingency funds to service loans if operations cease.
Germany restricts peer-to-peer lending to qualified investors with financial sophistication or net worth exceeding €100,000. This limitation prevents retail participation in favor of institutional and high-net-worth lenders. France and Spain permit broader retail access under disclosure frameworks similar to securities regulation.
Asian markets show extreme regulatory variation. Japan requires platform licensing and imposes strict capital requirements that limit market entry. Singapore promotes fintech innovation through regulatory sandboxes that allow controlled experimentation before full licensing. India restricts p2p lending to registered non-banking financial companies with minimum capital of ₹2 crores (approximately $240,000).
Platform Selection Criteria
Prospective users should evaluate platform track records spanning multiple economic cycles. Operators with histories predating 2015 demonstrated resilience through varied market conditions. Newer platforms lack performance data during recession periods when default rates typically spike.
Loan volume consistency indicates platform health and market acceptance. Declining origination volumes may signal competitive pressures, regulatory challenges, or deteriorating borrower quality. Growing platforms show quarterly volume increases and expanding geographic or product reach.
Fee transparency separates reputable operators from predatory actors. Detailed fee schedules published prominently on platform websites demonstrate commitment to informed user decisions. Hidden fees, unclear pricing structures, or charges buried in legal documents raise concerns about platform integrity.
Customer service quality matters significantly when problems arise. Responsive support teams that resolve issues within 24 to 48 hours maintain user satisfaction. Platforms with poor service records generate complaint volumes visible through consumer protection agencies and review aggregators. Investors should compare P2P investment platforms carefully before committing capital.
Third-party ratings from organizations like the Lending Club Borrower Payment Dependent Notes Rating or Moody's P2P platform assessments provide independent quality signals. These evaluations examine loan performance, operational controls, and financial stability using standardized methodologies.
Risk Management for Participants
Lenders should never invest capital required within five years. P2P loans tie up capital for extended periods with limited liquidity. Economic downturns can elevate default rates above historical averages, temporarily depressing returns and potentially generating losses on specific vintage years.
Conservative lenders limit p2p allocations to 5% to 10% of investable assets. This sizing ensures portfolio diversification across asset classes while capturing returns unavailable in traditional fixed income products. Aggressive allocators might reach 15% to 20% with appropriate risk tolerance.
Borrowers must assess total loan costs including origination fees, monthly payments, and opportunity costs of debt service. A 12% interest rate with 5% origination fee produces an effective annual rate near 13.5% over a three-year term. Comparing all-in costs against alternatives prevents suboptimal borrowing decisions.
Default consequences vary by jurisdiction but typically include collections activity, credit score damage, and potential legal action. Most platforms report payment history to credit bureaus after 30-day delinquency. Charge-offs appear on credit reports for seven years, substantially impacting future credit access.
Economic sensitivity affects both borrower repayment capacity and lender returns. Unemployment spikes during recessions elevate default rates across all credit grades. Lenders entering platforms during economic expansions should anticipate mean reversion as credit cycles turn.
Future Development Trajectories
Institutional capital increasingly flows into p2p lending markets. Hedge funds, pension funds, and insurance companies now provide 40% to 60% of capital on major platforms. This shift improves funding reliability but may reduce returns available to individual lenders as institutions bid down yields.
Blockchain integration experiments aim to reduce operational costs and increase transparency. Distributed ledger technology could automate loan servicing, enable fractional loan trading, and create immutable payment records. Production implementations remain limited as technology matures.
Artificial intelligence advancement continues improving credit assessment accuracy. Neural networks analyzing thousands of variables outperform traditional models by 15% to 25% in default prediction. These gains translate to better risk pricing and expanded credit access for previously marginal applicants.
Cross-border lending platforms face regulatory complexity but offer diversification benefits. International platforms allow lenders to access markets with different economic cycles and borrower profiles. Currency risk and jurisdiction-specific regulations currently limit mainstream adoption.
Product expansion beyond unsecured loans includes real estate, invoice financing, and litigation funding. Specialized platforms targeting niche borrower segments attract lenders seeking uncorrelated returns. These markets remain smaller than core consumer lending but grow faster from lower bases. Exploring crowdfunding investments reveals additional opportunities in this evolving landscape.
The direct connection between capital providers and capital users defines p2p crowdlending's core value proposition. Participants accepting appropriate risks for their situations access benefits unavailable through traditional financial channels. Market maturation and regulatory evolution continue shaping this sector's role in modern finance.
