The £10,000 question facing UK investors today
Holding £10,000 in cash means watching inflation erode roughly £200–300 in purchasing power each year at current rates. That reality pushes savers toward investment, yet 2025 presents a fragmented landscape: traditional equities trade near record valuations, bond yields sit in uncomfortable middle ground, and peer-to-peer lending platforms have matured into regulated alternatives after the sector shakeout of 2020–2023.
The data tells a clear story. According to the FCA's 2024 Financial Lives survey, 41% of UK adults now hold investments outside traditional savings accounts, up from 29% in 2020. Meanwhile, P2P lending balances have stabilised at £4.2 billion after the pandemic-driven contractions, with the remaining platforms demonstrating stronger credit performance than pre-2020 averages.
Your £10,000 sits at a strategic threshold. Too small for institutional private placements, too large to ignore allocation decisions. This amount demands a framework that balances growth potential against the specific risks that have emerged in each asset class over the past three years.

What the numbers reveal about returns
P2P lending platforms report target returns between 4.5% and 12% annually in 2025, depending on credit grade and loan duration. These figures represent net returns after platform fees and estimated defaults, not gross interest rates.
RateSetter data through 2024 showed realised returns of 4.8% on their lowest-risk products and 8.2% on diversified portfolios mixing credit grades. Funding Circle's SME loans delivered 6.1% median returns for lenders with 12-month-plus holding periods. Platforms operating consumer loan books reported higher targets but also elevated default rates—typically 3–6% annually on unsecured personal lending.
Compare this to the FTSE 100, which returned 3.7% total return in 2024, or UK gilts at 4.1% yield for ten-year maturities as of January 2025. The arithmetic advantage appears obvious, yet the risk profiles differ fundamentally.
P2P returns depend on borrower creditworthiness filtered through platform underwriting. When that system works, returns exceed inflation by 200–500 basis points. When credit models fail—as seen with Lendy's 2019 collapse or Collateral's 2020 difficulties—capital losses can reach 40–70% on affected loan parts.
The survivor platforms have tightened standards considerably. Zopa, now a fully licensed bank, maintains loan-to-income ratios below 4:1 and requires credit scores above 650 for prime products. Default rates on loans originated since 2022 run at 1.8–2.4%, roughly half the 2018–2019 levels.
Your £10,000 could generate £480–820 annually on P2P platforms, assuming reinvestment of returns and average credit performance. That income arrives monthly as borrowers make payments, creating cash flow traditional equity investments cannot match without selling shares. Maclear provides a regulated platform for exploring these opportunities.
Traditional equity markets: valuation context matters
UK equities trade at 11.2x forward earnings as of March 2025, below the 10-year average of 12.8x but above the post-Brexit trough. The FTSE 250, more domestically focused than the FTSE 100, sits at 13.4x earnings with a dividend yield of 3.1%.
These multiples embed specific assumptions: that inflation remains between 2–3%, that interest rates stabilise near 4.5%, and that corporate margins hold near current levels despite wage pressure. History suggests one of these assumptions typically proves wrong in any given 18-month period.
The advantage of equities remains their inflation-linked cash flows. Companies can raise prices when costs increase; bondholders cannot. Over rolling ten-year periods since 1990, UK equities have outperformed inflation by an average of 4.2% annually, though with standard deviation of 14%—meaning significant year-to-year volatility.
A £10,000 equity allocation split 60/40 between FTSE 100 and FTSE 250 index trackers would cost roughly £15–20 in annual platform fees through providers like Vanguard or iShares. Expected return sits near 6–7% annually over five years based on historical mean reversion, but single-year outcomes could range from -15% to +25%.
The critical difference from P2P: equity capital remains liquid. You can sell FTSE tracker units within seconds at market price. P2P loans lock capital for terms of 12–60 months, with secondary markets offering limited liquidity at discounts of 1–5% in normal conditions.
Bond allocation: the new 4% reality
UK government gilts now yield 4.0–4.4% depending on maturity, the highest levels since 2010. Corporate investment-grade bonds add 80–150 basis points above gilts, putting total yield at 4.8–5.9% for BBB-rated issuers.
These yields reflect expectations of rate cuts totalling 50–75 basis points through 2025, now largely priced into the curve. If the Bank of England cuts more aggressively, bond prices rise and total returns exceed 5–6%. If inflation persists and rates hold, you receive the coupon but no capital gain.
The math on £10,000 in a gilt fund or investment-grade corporate bond ETF produces £400–440 annually with minimal credit risk. The government has never defaulted on sterling debt; corporate defaults among investment-grade UK issuers run at 0.2% annually over the past 20 years.
Duration risk remains the primary concern. A 50-basis-point rise in yields translates to roughly 2.5% capital loss on a five-year duration bond portfolio. Given current rate uncertainty, shorter-duration bonds (2–3 years) trade with less price volatility while sacrificing only 30–40 basis points in yield.
Bond allocation makes sense for capital you cannot afford to lose and do not need to access for 12 months minimum. The return barely exceeds inflation, but the path is predictable—qualities P2P and equities cannot guarantee. For those seeking safe investment options, bonds remain a cornerstone.
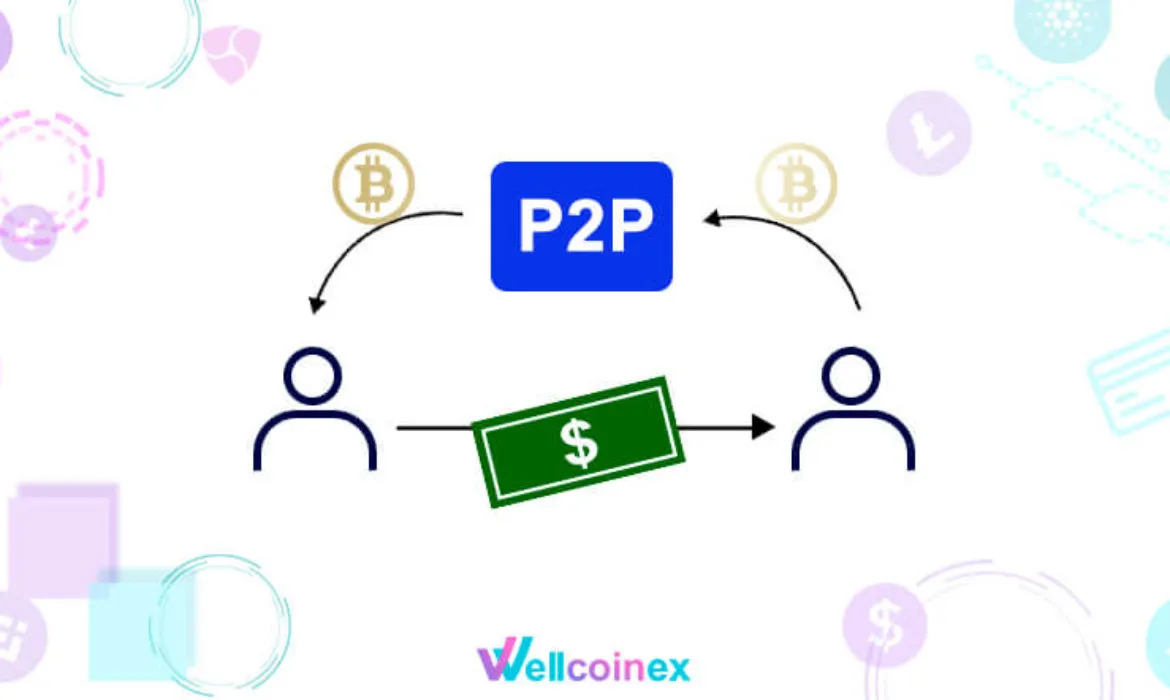
Building a hybrid portfolio: allocation frameworks
Few investors achieve optimal results by concentrating £10,000 in a single asset class. The correlation between P2P, equities, and bonds sits below 0.3 in most market environments, meaning losses in one category rarely coincide with losses in others during the same quarter.
A defensive allocation might allocate 40% to bonds, 35% to equity index trackers, and 25% to P2P platforms with strong track records. This produces expected return of 5.2–6.1% with moderate volatility, suitable for investors who need capital accessibility within 18–24 months or have limited risk tolerance.
A growth-oriented structure could shift to 50% equities, 35% P2P, and 15% bonds. Expected return rises to 6.8–8.2% but year-to-year volatility increases substantially. This allocation assumes no capital need for 36 months and acceptance of potential 10–12% drawdowns during market stress.
The numbers behind these allocations come from mixing return assumptions (P2P at 6.5%, equities at 7%, bonds at 4.2%) with their respective volatilities. Portfolio theory suggests optimal diversification occurs when no single asset exceeds 50% of capital, though this rule bends for younger investors with long time horizons.
Platform selection within P2P allocation matters significantly. Splitting £2,500–3,500 across two platforms reduces single-platform risk. Zopa and Funding Circle currently maintain the strongest capitalisation and longest operating histories among UK P2P survivors. Newer platforms like Folk2Folk or Lending Works offer property-backed or provision-fund structures that change risk characteristics. When evaluating options, it's worth learning to compare P2P investment platforms systematically.
Tax efficiency: the often-ignored multiplier
Investment returns quoted above represent pre-tax figures. Actual wealth accumulation depends heavily on wrapper selection—the difference between ISA sheltering and taxable accounts reaches £180 annually on a £10,000 P2P investment returning 6%.
Stocks and Shares ISAs accommodate both P2P investments and traditional securities, with £20,000 annual allowance for 2025–26. P2P interest payments and equity dividends grow tax-free within the wrapper. Outside an ISA, P2P interest counts as income taxed at your marginal rate (20%, 40%, or 45%), while equity dividends face 8.75% to 39.35% rates above the £500 dividend allowance.
The math becomes stark for higher-rate taxpayers: £600 in P2P income generates £240 tax liability, dropping net return from 6% to 3.6%. The same £600 inside an ISA incurs zero tax. Over ten years with compound growth, this differential produces £1,840 additional wealth in the ISA structure.
Capital gains on equities receive a £3,000 annual exemption, then face 20% tax for higher-rate payers. P2P loans generate no capital gains—only income—so the CGT exemption provides no benefit. This creates a slight advantage for holding P2P in ISAs and keeping some equity exposure in taxable accounts where gains might stay below exemption thresholds.
Pension wrappers (SIPP) offer 25% tax relief on contributions but lock capital until age 55 minimum. For £10,000 you can access within a decade, ISA structures provide better flexibility despite lacking upfront tax relief.
Risk factors the promotional materials understate
P2P platforms emphasise diversification—spreading £10,000 across 200+ individual loans to reduce single-borrower impact. The mathematics work on idiosyncratic risk but fail during systemic credit deterioration.
In 2020, P2P default rates tripled within eight weeks as pandemic lockdowns hit borrower income. Platforms with provision funds saw those reserves deplete in months. Investors who needed liquidity faced secondary market discounts of 15–25% or waited 18+ months for loan maturities.
This systemic risk distinguishes P2P from equity market drops. When stocks fall 20%, you still own the shares and can sell at market price. When P2P loans default en masse, capital is impaired permanently. Recovery rates on unsecured consumer P2P loans average 12–18% after expenses, meaning £1,000 in defaulted loans returns £120–180.
The regulatory framework has strengthened. FCA rules since 2020 require platforms to maintain wind-down plans and provide clearer risk warnings. Yet P2P remains excluded from FSCS protection that covers bank deposits up to £85,000. If a platform fails financially, your loan parts may become difficult to service or collect.
Equity risk expresses differently—through volatility rather than capital impairment. The FTSE 100 has experienced seven separate 15%+ declines since 2000, but index values ultimately recovered in every case. Individual company failures like Thomas Cook or Carillion can produce total losses, which is why diversification through index funds matters for £10,000 portfolios.

The liquidity timeline: matching capital needs to assets
Investment decisions should begin with capital availability requirements, not return targets. Money needed within 12 months belongs in cash or money market funds yielding 4.5–5.0% as of March 2025. The potential extra 1–2% from P2P or equities cannot justify illiquidity or volatility risk on short horizons.
The 12–36 month horizon suits bond allocations or short-term P2P loans. Three-year gilts yield 4.1% with minimal credit risk and reasonable secondary market liquidity. P2P platforms offer 12-month loan products at 5–6% returns, though early exit depends on secondary market conditions.
Capital available for 3+ years opens both equity and longer-term P2P options. Historical data shows equity holding periods beyond 36 months reduce probability of nominal loss to below 15%, while P2P loans at 36–60 month terms often carry 1–2% higher interest rates than shorter equivalents. Understanding long term investment strategies becomes essential at this horizon.
A practical approach splits £10,000 by time horizon: £3,000 in accessible positions (short bonds, money market), £4,000 in medium-term holdings (1–3 year P2P, short-duration bond funds), and £3,000 in growth assets (equity trackers). This structure provides liquidity for emergencies while maintaining growth potential on capital not needed immediately.
Platform mechanics: what £10,000 actually buys
Investing £10,000 through P2P platforms typically involves opening an account, completing FCA-required risk assessments, and selecting auto-invest criteria or manual loan selection. Minimum investments per loan run £10–20, enabling 500–1,000 loan part diversification with your capital.
Funding Circle's model lends to small businesses with loan amounts of £10,000–£500,000. Your £10,000 might split across 50+ business borrowers in £200 chunks. Interest and principal repayments arrive monthly, which you can withdraw or reinvest. The platform charges 1% annual servicing fee on outstanding capital.
Zopa operates a pooled model where you select a risk category and capital is algorithmically allocated across consumer borrowers. Returns target 5.1% on Core, 6.2% on Plus, and 7.0% on Max risk levels. Default rates increase with each tier, from 1.8% to 4.1% historically.
For equities, £10,000 buys approximately 1,200 units of a FTSE All-Share tracker at current pricing, with dealing fees of £0–10 depending on platform. Vanguard charges 0.15% ongoing fee on ETF products; platform fees add another 0.15–0.45% annually depending on provider.
Bond investments through ETFs like iShares Core UK Gilt cost 0.07% annually in fund fees, among the lowest-cost options available. Individual gilt purchases through brokers avoid ongoing fees but require larger minimums—typically £5,000 per issue—and incur bid-offer spreads of 0.2–0.5%.
Drawing conclusions: the best place depends on your constraints
No universal "best" exists for £10,000 investment—only optimal choices within individual circumstances. A 35-year-old with stable income, emergency fund established, and no capital needs for five years faces different optimal allocation than a 55-year-old approaching retirement who may need funds for home repairs.
The data supports several firm conclusions. First, P2P lending offers viable returns between inflation and equity markets, with risk profile between bonds and stocks. Platforms that survived the 2020–2023 consolidation demonstrate stronger credit controls than earlier industry entrants.
Second, equity index exposure remains essential for long-term wealth building. The 7% annualised returns over 10+ year periods compound to double capital, which 4–5% fixed income cannot match. The cost comes in volatility and sequencing risk—buying before a major decline impairs results for years. Exploring income investing approaches can help balance growth with cash flow needs.
Third, bond allocation provides stability and capital preservation that growth assets cannot guarantee. At current 4% yields, bonds finally offer real returns above inflation again, reversing the 2010–2022 dynamic where negative real yields made fixed income unattractive.
The research suggests splitting £10,000 across all three categories based on risk tolerance and time horizon. A balanced structure might
