











The Shift Toward Direct Lending Models
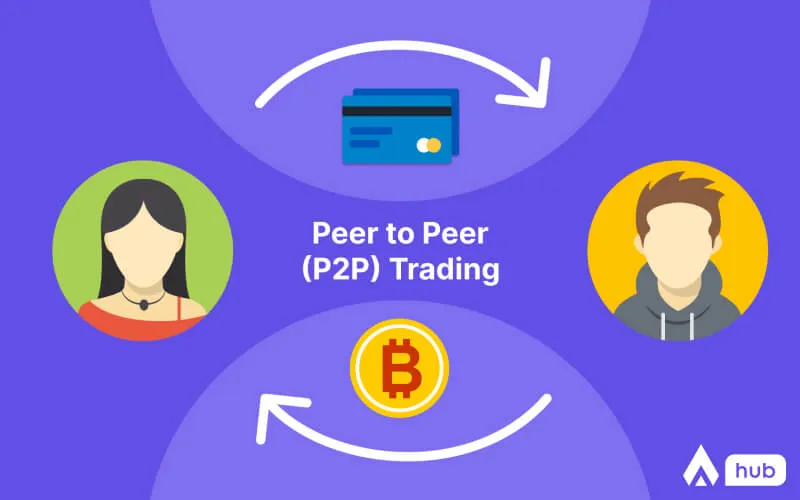
Traditional investment vehicles have dominated portfolios for decades, but a fundamental restructuring of capital allocation is underway. Peer-to-peer lending platforms have emerged as a discrete asset class, allowing capital providers to bypass conventional financial intermediaries and connect directly with borrowers. This disintermediation creates a distinct risk-return profile that merits serious examination.
The numbers tell a compelling story. Global P2P lending volumes reached $67.9 billion in 2022, with projections indicating a compound annual growth rate of 28.2% through 2030. These platforms now serve over 18 million active lenders worldwide, a figure that has tripled since 2018. For investors seeking portfolio diversification beyond equities and fixed income, this channel represents a quantifiable alternative with documented performance data spanning more than 15 years.
Direct lending through digital platforms eliminates multiple layers of traditional banking infrastructure. When you allocate capital through these channels, your funds move directly to verified borrowers, with the platform serving solely as a matching and servicing intermediary. This structural simplicity translates to a fundamental economic advantage: reduced overhead costs mean higher net yields for lenders while still offering competitive rates to borrowers.

Historical Returns and Performance Data
Empirical evidence from established platforms provides insight into actual performance metrics. Between 2010 and 2023, major P2P lending platforms in the United States reported annualized returns ranging from 4.8% to 9.2% for diversified portfolios. UK platforms showed similar patterns, with median returns of 6.3% across all investor cohorts during the same period.
These figures require context. Default rates across the industry averaged 3.1% annually for consumer loans and 2.4% for business loans between 2015 and 2022. Platforms with rigorous credit scoring models and loan pricing mechanisms showed significantly lower default rates—some maintaining figures below 1.8% on prime-grade borrowers.
The distribution of returns demonstrates considerable variance based on risk selection. Conservative portfolios concentrating on A-grade borrowers typically delivered 4-5% annually, while strategies incorporating B and C-grade loans achieved 7-10% with commensurately higher default incidence. This granular risk-return relationship allows precise calibration of portfolio exposure.
Recovery rates matter as much as default rates. Industry data shows that secured business loans recovered an average of 48 cents on the dollar after default, while unsecured consumer loans recovered only 12 cents. These recovery differentials significantly impact net returns and should factor into any allocation decision.
Risk Architecture and Loss Mitigation
Every investment opportunity carries embedded risk, and P2P lending presents a specific set of exposures that demand rigorous analysis. Credit risk dominates the landscape—the probability that borrowers fail to meet payment obligations. Unlike bank deposits or government securities, these loans carry no government guarantee or insurance backstop.
Platform risk constitutes a second critical exposure. If the intermediary platform fails financially or operationally, loan servicing may be disrupted even if the underlying borrowers remain current. Between 2018 and 2022, approximately 14% of P2P platforms globally either ceased operations or significantly curtailed services. Due diligence on platform stability, regulatory compliance, and operational track record becomes essential.
Liquidity risk distinguishes P2P loans from publicly traded securities. Most loans carry fixed terms ranging from 12 to 60 months with no established secondary market. While some platforms offer limited liquidity mechanisms through loan resale features, these typically involve pricing discounts of 2-4% and may not function during periods of market stress.
Concentration risk amplifies when investors allocate excessive capital to single borrowers or narrow sectors. Data from 2020-2021 demonstrated this clearly: investors heavily concentrated in hospitality-sector loans experienced default rates exceeding 18% during pandemic disruptions, while diversified portfolios maintained defaults near 4%.
Mitigation strategies exist and produce measurable results. Portfolio diversification across 100+ loans reduces idiosyncratic risk by 73% compared to concentrated holdings of fewer than 20 loans. Automated investing tools that spread capital across risk grades and loan types have shown 2.1 percentage points lower volatility than manual selection strategies.
How it works and what protects you
- Each investment is an assigned claim to a vetted business loan; the borrower signs the loan agreement with the platform and you hold the assigned claim.
- Interest is paid monthly, and the principal is repaid at the end of the loan term.
- The AAA–D borrower score is a signal to help you weigh risk, not investment advice.
- Collateral is held through a Collateral Agent, with the loan-to-value ratio shown for transparency; liquidation is not immediate.
- A provision fund may absorb temporary delays in interest, but it is not insurance and does not guarantee that principal comes back.
- Capital is at risk, including possible total loss.
Structural Advantages Over Traditional Channels
Direct lending platforms offer several architectural benefits that distinguish them from conventional investment opportunities. Transparency stands foremost—every loan displays detailed borrower information, credit metrics, loan purpose, and employment verification. This granular disclosure exceeds what most bond investors receive about corporate or municipal debt issuers.
Control over capital allocation represents another differentiator. You select specific loans based on your risk tolerance, geographic preference, sector exposure, and return targets. This contrasts sharply with mutual funds or ETFs where investment decisions remain opaque and beyond investor influence.
Yield enhancement stems from the elimination of multiple intermediary layers. Traditional banks borrow deposits at 0.5-2%, then lend at 8-15%, capturing the spread as profit. P2P platforms compress this spread by 60-70%, passing the majority of interest payments directly to lenders while charging only servicing fees of 1-2%.
Monthly cash flow provides consistent income generation. Unlike bonds that pay semiannually or stocks with variable dividends, P2P loans deliver monthly principal and interest payments. For investors requiring regular income, this predictable cash flow pattern offers planning advantages.
Tax treatment in certain jurisdictions creates additional value. In the UK, P2P loans held within Innovative Finance ISAs grow tax-free. Similar preferential structures exist in other markets, though tax regulations vary significantly by jurisdiction and require professional consultation.
How Maclear compares with a bank savings account
| Feature | Maclear (P2P loan claims) | Bank savings / deposit account |
|---|---|---|
| Minimum to start | From €50 on the Primary Market (€30 on the Secondary Market) | Varies by provider; often little or no minimum |
| Investor fees | No fees for investors | Varies by provider; account or service charges may apply |
| Income schedule | Monthly interest payments | Varies by provider; interest usually credited periodically |
| Principal | Repaid at the end of the loan term; capital at risk, including possible total loss | Principal generally preserved within provider protection limits |
| Target return | Target/potential up to 16.5% APR, subject to borrower risk and possible capital loss (average rate across listed loans 14.5%) | Rate set by the provider, typically modest |
| Term | 6 to 36 months | Varies by provider; from instant access to fixed terms |
| Currency | Euro | Varies by provider |
| Credit/borrower scoring | Internal AAA–D scoring; a signal, not investment advice | Not applicable; the provider holds the funds |
| Collateral | Held via a Collateral Agent, with the LTV shown for transparency | Not applicable |
| Provision fund | May absorb temporary delays in interest; not insurance, not a guarantee of principal | Not applicable |
Maclear figures accurate as of 2026. Not investment advice; capital is at risk, including possible total loss.
A P2P allocation works as a portfolio addition, roughly 10%, not a replacement for lower-risk instruments.

Portfolio Construction Methodologies
Optimal allocation strategy begins with defining your investment timeline and liquidity requirements. Capital needed within 12 months should not flow into P2P loans given their illiquid nature. The investment opportunity becomes most attractive for capital allocated on 3-5 year horizons or longer.
Diversification across loan grades forms the foundation of sound portfolio construction. A balanced approach might allocate 40% to A-grade loans (4-5% yield, <1% default probability), 40% to B-grade (6-7% yield, 2-3% default probability), and 20% to C-grade (9-11% yield, 5-6% default probability). This distribution historically produced net returns of 6.2% with managed volatility.
Sector diversification adds a second layer of risk reduction. Allocating across consumer loans, business loans, property-backed loans, and invoice financing prevents correlated defaults. Economic downturns impact sectors asymmetrically—consumer credit may deteriorate while invoice financing remains stable, or vice versa.
Geographic distribution matters for investors accessing international platforms. Currency risk and regulatory differences create both opportunities and exposures. Some investors maintain 70% domestic and 30% international allocations to capture yield differentials while managing foreign exchange volatility.
Loan term selection influences both yield and liquidity. Shorter-term loans (12-24 months) offer faster capital recycling and reduced exposure to borrower circumstances changing over time. Longer terms (36-60 months) typically command higher interest rates but lock capital for extended periods.
Reinvestment discipline determines compound growth trajectories. Automatic reinvestment of monthly payments into new loans creates compound effects—a $10,000 initial investment earning 7% with full reinvestment grows to $14,026 after five years, compared to $13,500 if payments are withdrawn monthly.
Due Diligence Framework for Platform Selection
Not all platforms demonstrate equal operational quality or regulatory compliance. Your selection process should evaluate specific criteria with measurable thresholds.
Regulatory authorization provides baseline credibility. In the United States, platforms must register with the SEC and comply with securities regulations. UK platforms require FCA authorization. European platforms operate under national regimes with varying stringency. Platforms lacking proper licensure present unacceptable operational risk.
Track record duration and volume indicate stability. Platforms operating for five or more years with cumulative loan volumes exceeding $500 million have demonstrated business model viability through multiple credit cycles. Newer platforms may offer attractive terms but carry higher platform failure risk.
Default rate transparency separates professional operators from marginal players. Reputable platforms publish monthly default statistics across all loan grades with historical data readily accessible. Platforms obscuring performance data or publishing only selective metrics warrant skepticism.
Skin in the game matters. Platforms that co-invest their own capital alongside investor funds align incentives more effectively than those purely extracting fees. Several leading platforms maintain co-investment rates of 5-10% in every loan funded.
Recovery and collections capabilities directly impact net returns. Platforms with in-house collections teams recover 30-40% more from defaulted loans than those outsourcing to third-party agencies. Review published recovery rates and collections methodologies before committing capital.
Buyback guarantees or provision funds offer additional protection on some platforms, particularly those operating in European and Asian markets. These mechanisms commit the platform to repurchasing loans delinquent beyond 60 days or provide reserve funds covering partial losses. While valuable, these protections are only as robust as the platform's financial strength.
Tax Implications and Reporting Requirements
P2P lending generates ordinary income subject to your marginal tax rate in most jurisdictions. Unlike qualified dividends or long-term capital gains that may receive preferential rates, interest income typically faces full taxation.
Annual reporting varies by platform and jurisdiction. US investors receive 1099 forms documenting interest income and any charge-offs eligible for bad debt deductions. UK investors receive annual statements compatible with self-assessment tax returns. Maintaining detailed records of all investments, income received, and realized losses becomes essential for accurate reporting.
Loss deductions follow specific rules. In the United States, charged-off loans may qualify as capital losses subject to the $3,000 annual limitation against ordinary income, with excess losses carried forward. The IRS disallows deductions until loans are conclusively deemed uncollectible, typically after platform write-off.
Tax-advantaged accounts in certain markets provide significant benefits. The UK's Innovative Finance ISA allows up to £20,000 annual investment in P2P loans with all returns sheltered from taxation. Self-directed IRAs in the United States can hold P2P loans in some circumstances, though custodial complexity and fees often negate advantages.
Cross-border investments introduce withholding taxes and treaty considerations. Foreign platforms may withhold taxes on interest payments, potentially creditable against your domestic tax liability. The administrative complexity of claiming foreign tax credits often makes domestic platforms more efficient from a tax perspective.
Integration Within Broader Asset Allocation
P2P loans function as a distinct asset class with correlation characteristics that enhance portfolio diversification. Historical data shows correlations of 0.32 with the S&P 500 and 0.41 with investment-grade corporate bonds—low enough to provide genuine diversification benefits.
Modern portfolio theory suggests that assets with returns above 5% and correlations below 0.6 with existing holdings merit inclusion. P2P loans meet both thresholds for most equity-and-bond portfolios. Allocations of 5-15% to direct lending can improve risk-adjusted returns measured by Sharpe ratios.
The investment opportunity becomes particularly relevant during specific market environments. When central banks suppress interest rates, traditional fixed income delivers minimal yields. P2P loans maintained yields above 6% even during 2020-2021 when government bonds yielded below 1%. This yield premium averaged 490 basis points during low-rate periods.
Rebalancing discipline matters more with illiquid assets. Unlike stocks or bonds that you can quickly sell to rebalance, P2P loans require planning. Setting new capital aside for periodic rebalancing or using monthly P2P payment inflows to adjust other asset classes maintains strategic allocation without forced selling.
Performance Monitoring and Portfolio Management
Active monitoring distinguishes successful P2P investors from those experiencing below-average outcomes. Monthly review of default rates, delinquency trends, and platform communications identifies early warning signals requiring action.
Delinquency progression provides leading indicators. Loans moving from current to 15 days late, then 30 days late, follow predictable patterns. Early-stage delinquencies (15-30 days) cure approximately 65% of the time, while those reaching 60+ days default 78% of the time. Monitoring these progressions allows proactive response.
Platform health indicators require attention beyond your own portfolio. Declining loan origination volumes, management changes, regulatory warnings, or negative press coverage may signal deteriorating platform stability. Several platforms that ultimately failed showed these warning signs 6-12 months before collapse.
Performance attribution analysis reveals which strategies drive returns. Tracking results by loan grade, term length, sector, and borrower characteristics identifies your most effective selections. Data-driven investors adjust future allocations based on this empirical evidence rather than intuition.
Secondary market activity, where available, offers periodic liquidity and rebalancing opportunities. Selling loans at premiums when demand exceeds supply or purchasing discounted loans from motivated sellers creates incremental returns beyond stated interest rates.
Current Market Environment and Forward Outlook
The 2022-2024 interest rate environment significantly impacted P2P lending dynamics. As central banks raised rates from near-zero to 4-5%, traditional fixed income became more competitive. P2P loan rates increased concurrently, rising from 6-8% average yields in 2021 to 8-11% by 2023, maintaining their premium over conventional alternatives.
Credit quality shifts during rate increase cycles. Higher borrowing costs strain marginal borrowers, increasing default risks. Industry-wide default rates increased from 3.1% in 2021 to 4.7% in 2023 as economic headwinds intensified. Investors adjusting to higher-quality borrowers maintained default rates near historical norms.
Regulatory evolution continues reshaping the landscape. European regulations implemented in 2023 standardized disclosure requirements and capital adequacy standards for platforms. These requirements increased operational costs but improved investor protection and platform stability.
Technological advancement enables more sophisticated credit assessment. Platforms incorporating open banking data, machine learning credit models, and real-time income verification reduced default rates by 30-40% compared to traditional credit score-only models. This technological edge strengthens the investment opportunity as predictive capabilities improve.
Competition among platforms intensified through 2023, creating a buyer's market for investors. Platforms offering enhanced investor protections, improved transparency, and competitive fee structures gained market share while weaker operators exited. This consolidation improves overall industry quality.
The investment opportunity in P2P lending continues maturing from an emerging alternative to an established asset class. With over $450 billion in cumulative loans funded globally and institutional investors now allocating capital alongside retail participants, the channel has achieved mainstream validation while retaining the structural advantages that initially attracted early adopters.

