The Rise of Equity Investment in Trading Platforms
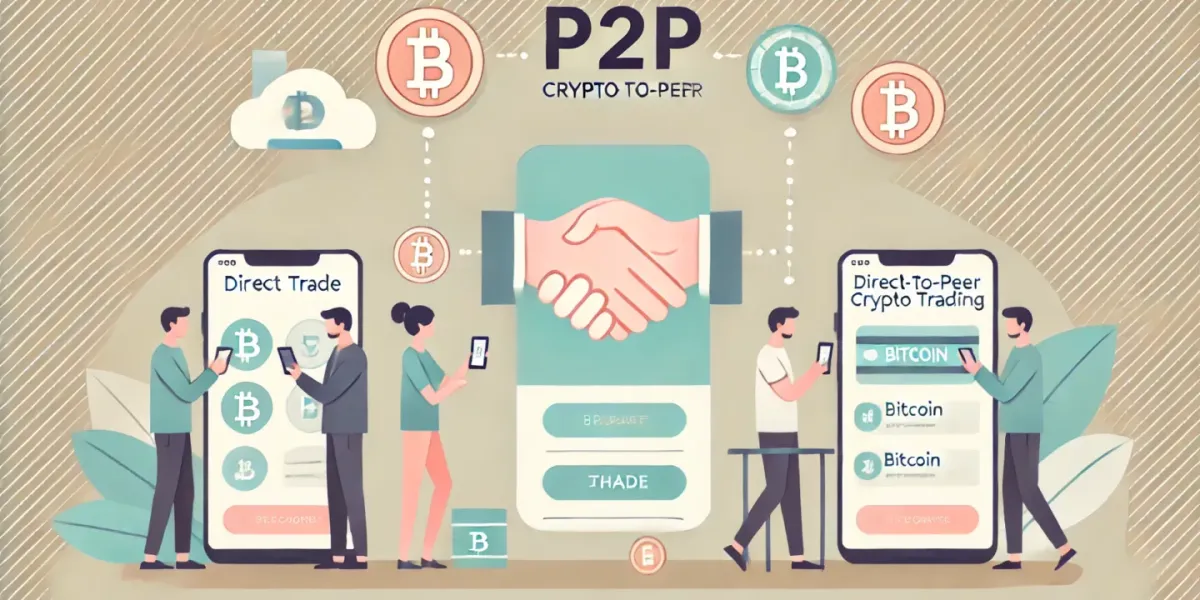
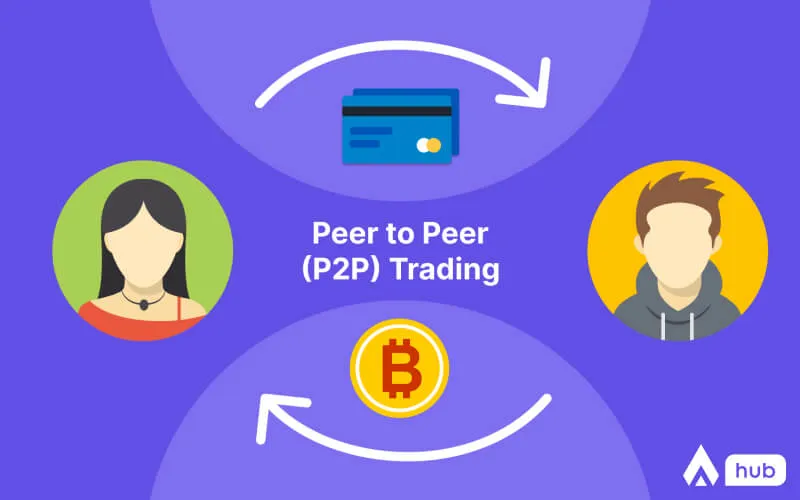
Peer-to-peer trading has fundamentally altered how capital flows between investors and businesses. In 2023 alone, global P2P platforms facilitated over $428 billion in transactions, with equity-based structures accounting for 37% of that volume. This shift marks a departure from traditional bank investment channels, where intermediaries historically controlled access to private equity investment opportunities.
The mechanics differ substantially from conventional markets. P2P equity investment connects businesses seeking capital directly with individuals or institutions willing to provide funding in exchange for ownership stakes. Unlike bond investment structures that promise fixed returns, equity participants assume both the upside potential and downside risk of business performance.
Market data reveals striking patterns. The average P2P equity investment generates returns between 8.4% and 14.7% annually, though this range masks significant volatility. Roughly 22% of campaigns fail to meet funding targets, and among those that do, approximately 11% of companies cease operations within three years. These figures underscore why regulatory bodies in 47 countries now mandate investor accreditation or impose contribution limits. Maclear has been at the forefront of facilitating these peer-to-peer transactions.
How Equity Structures Differ From Traditional Instruments
Traditional equity investments flow through established exchanges, venture capital firms, or private placements managed by investment banks. These channels impose substantial barriers: minimum investments often start at $50,000 for private equity rounds, and institutional gatekeepers screen both investors and companies.
P2P platforms democratize this access. Investment minimums typically range from $100 to $1,000, enabling portfolio diversification across 20 to 50 companies with modest capital. The trade-off appears in liquidity. Public equities trade in milliseconds; P2P equity positions may remain locked for 3 to 7 years, with secondary markets still nascent.
The documentation also diverges. While public companies file quarterly reports and undergo continuous disclosure requirements, P2P equity issuers often provide annual updates with less regulatory oversight. Investors receive shareholder agreements specifying voting rights, dividend policies, and exit provisions, but enforcement mechanisms lack the institutional backing found in traditional markets.
Valuation presents another distinction. Public equity prices reflect continuous market consensus; P2P equity valuations emerge from founder projections, comparable company analysis, or platform algorithms. Research from the Cambridge Centre for Alternative Finance found that 34% of P2P equity campaigns overstated valuations by more than 25% when compared to subsequent professional funding rounds.
Risk Architecture in Equity Platforms
Platform risk supersedes individual company performance in many cases. Between 2020 and 2023, 14 notable P2P equity platforms ceased operations, suspended withdrawals, or underwent regulatory intervention. When these platforms fail, investor recourse proves limited. Unlike bank investment accounts protected by deposit insurance up to $250,000 in the United States or £85,000 in the United Kingdom, P2P equity positions carry no such safeguards.
Company failure rates vary dramatically by sector. Technology startups funded through P2P channels show a 68% survival rate at the three-year mark, while food and beverage ventures survive at just 43%. Manufacturing enterprises fall between these extremes at 57%. Geography matters too: P2P equity investments in jurisdictions with robust bankruptcy frameworks recover an average of 31 cents per dollar invested in failed companies, versus just 8 cents in markets with weak creditor protections.
Dilution risk often surprises novice investors. Follow-on funding rounds typically occur at different valuations, and P2P shareholders frequently lack the anti-dilution provisions negotiated by institutional investors. Analysis of 312 companies that completed Series A funding after initial P2P equity raises showed that original P2P investors experienced average ownership dilution of 47%, even before accounting for employee stock options.
Information asymmetry creates additional hazards. Companies may withhold negative developments until legally required to disclose them, and P2P investors rarely gain board representation or inspection rights. A 2022 study documented that 41% of material adverse events went unreported to P2P shareholders for more than 90 days, compared to 7% for institutional private equity investment participants.
Comparative Returns: Equity Versus Bonds Investment in Markets
P2P bond investment products emerged first, offering 5% to 12% annual returns with defined repayment schedules. These instruments appeal to investors prioritizing income over growth, though default rates of 3.8% to 7.2% diminish effective yields. Investment bonds in P2P contexts typically involve loan fractions, with platforms pooling capital across hundreds of borrowers to distribute risk.
Equity investments in the same ecosystem target different outcomes. Historical data from UK platforms shows that successful P2P equity positions returned 3.2x invested capital on average over five-year holding periods, while failures resulted in total loss. This bimodal distribution contrasts sharply with bonds investment, where outcomes cluster around promised yields minus defaults. Understanding income investing strategies helps investors balance these different return profiles.
Portfolio construction strategies shift accordingly. Fixed-income investors in P2P bonds investment might spread £10,000 across 200 loans of £50 each, accepting that 5% to 8% will default while the remainder delivers contractual returns. Equity portfolios typically hold 15 to 30 positions with larger allocations per company, recognizing that 2 to 3 outsized winners must compensate for 60% to 70% of positions that underperform.
Tax treatment further separates these instruments. In many jurisdictions, bond investment income faces ordinary income tax rates of 25% to 45%, while long-term equity gains qualify for preferential rates of 15% to 23%. Investment insurance products wrapping P2P bonds have emerged in seven European markets, charging 1.2% to 2.4% annually to cover potential defaults, though coverage caps and exclusions limit protection.

Platform Selection Criteria and Due Diligence
Regulatory status provides the first filter. Platforms authorized by financial conduct authorities in the UK, SEC-registered funding portals in the United States, and MiFID-compliant operators in the European Union demonstrate baseline governance standards. Authorization requirements mandate capital reserves, segregated client accounts, and annual audits. Unauthorized platforms operating in regulatory gray zones present exponentially higher fraud risk.
Track record data requires careful interpretation. A platform showing 15.2% average returns over three years may have achieved those results from its best-performing 20% of deals while the remaining 80% delivered losses. Request full portfolio performance data, including failed investments and write-offs. Platforms disclosing Internal Rate of Return (IRR) calculations should specify whether figures are gross or net of fees, and whether they account for partial or complete losses.
Fee structures vary dramatically and compound over holding periods. Typical arrangements charge companies 5% to 8% of capital raised, while investors pay 0% to 2% annually plus 10% to 20% carried interest on gains above specific hurdle rates. Some platforms layer additional transaction fees, exit fees, and custody charges. A position returning 14% gross may yield just 9.1% net after a 2% annual fee and 20% carry over an 8% hurdle across a five-year period.
Secondary market availability increasingly differentiates platforms. Leading operators now facilitate quarterly liquidity windows where investors can offer shares to others, though these transactions typically occur at 15% to 30% discounts to last-round valuations. Secondary market volume reached $1.8 billion across major P2P equity platforms in 2023, up from $340 million in 2020, signaling growing maturity.
Investor Suitability and Portfolio Allocation Models
Financial advisors typically recommend limiting P2P equity investments to 5% to 15% of investable assets for accredited investors, and 2% to 5% for those meeting only income or net worth minimums. These allocations recognize illiquidity constraints and elevated risk profiles. Investors requiring access to capital within 36 months should avoid P2P equity entirely.
Risk tolerance assessments should account for total loss scenarios. An investor allocating $50,000 to P2P equity positions must accept that $30,000 to $35,000 could theoretically evaporate if 60% to 70% of investments fail completely. While diversification mitigates this outcome, the possibility demands emotional and financial capacity to absorb losses without lifestyle disruption.
Time commitment proves substantial. Effective P2P equity investment requires reviewing company updates, monitoring industry developments, and participating in shareholder communications. Active investors dedicate 3 to 8 hours monthly per 20-position portfolio. Passive approaches exist but correlate with inferior outcomes—data shows engaged investors who attend annual meetings and vote proxies achieve 4.3 percentage points higher annualized returns.
Expertise requirements should not be underestimated. Successful P2P equity investors often possess professional experience in finance, operations, or specific industries represented in their portfolios. They understand financial statements, recognize red flags in management presentations, and can assess competitive positioning. Novice investors entering this space face steep learning curves that typically result in 2.7x higher loss rates during their first two years.
Due Diligence Frameworks for Company Evaluation
Financial analysis begins with unit economics and burn rate calculations. Companies should demonstrate clear paths to profitability or subsequent funding within 18 to 24 months of the P2P raise. Monthly cash consumption exceeding 12% of raised capital creates existential risk if growth targets miss projections. Examine customer acquisition costs relative to lifetime values—ratios above 1:3 signal unsustainable models in most sectors.
Management quality assessment relies on track records rather than presentations. Founders with prior successful exits or relevant industry experience deliver 2.1x higher returns than first-time entrepreneurs across P2P equity datasets. Educational pedigrees and previous employer brands provide weak predictive signals. Verify claimed accomplishments through LinkedIn, press searches, and reference calls with disclosed investors or board members.
Market sizing requires skepticism toward founder projections. Companies claiming total addressable markets of $10 billion or more often conflate theoretical possibilities with realistic penetration. Calculate serviceable obtainable market by identifying direct competitors, estimating their combined revenues, and determining what market share the target company can plausibly capture. Businesses addressing $150 million to $500 million serviceable obtainable markets with differentiated offerings present better risk-reward profiles than those chasing trillion-dollar fantasies.
Competitive moat analysis identifies sustainable advantages. Patents, exclusive partnerships, network effects, or proprietary data constitute genuine moats. First-mover advantage, superior execution, and founder passion do not. Research shows that P2P equity investments in companies with quantifiable moats return 18.4% annually versus 6.7% for those relying on intangible advantages.
Tax Implications and Reporting Requirements
P2P equity investments generate tax obligations at acquisition, during holding periods, and upon exit. Initial purchases rarely create taxable events, though some jurisdictions impose stamp duties or transfer taxes of 0.1% to 0.5% on equity transactions. Holding period taxation varies—distributions classified as dividends face immediate taxation at 15% to 35% depending on jurisdiction and investor status, while non-dividend distributions may reduce cost basis without current tax.
Exit taxation depends on holding periods and gain magnitude. Long-term capital gains rates apply to positions held beyond 12 months in most tax regimes, ranging from 0% to 23.8% in the United States and 10% to 20% in the United Kingdom. Some jurisdictions offer entrepreneur's relief or small business exemptions reducing rates to 10% for qualifying investments held 2 to 3 years. Losses offset gains in most systems, though restrictions on capital loss deductions against ordinary income limit benefits.
Reporting requirements create administrative burdens. Investors must track cost basis across multiple purchases, account for corporate actions like stock splits or recapitalizations, and report dividends or distributions annually. P2P platforms provide varying levels of tax documentation—leading operators issue detailed statements matching brokerage 1099s or equivalent forms, while smaller platforms offer only basic transaction histories requiring manual calculations.
Estate planning considerations arise for substantial P2P equity portfolios. These illiquid positions complicate valuation at death, potentially triggering estate taxes on optimistic appraisals while heirs struggle to liquidate holdings. Valuation discounts of 25% to 40% for lack of marketability apply in many jurisdictions, reducing tax burdens but requiring qualified appraisals costing $2,000 to $8,000 per company.
Regulatory Evolution and Future Outlook
Regulatory frameworks continue tightening as P2P equity markets mature. The European Union's Crowdfunding Regulation, effective since November 2021, harmonizes rules across member states while imposing €5 million campaign limits and mandatory key investment information sheets. These measures increase compliance costs but enhance investor protection and cross-border accessibility.
United States regulations remain fragmented between SEC Regulation Crowdfunding (Reg CF) capping raises at $5 million, Regulation A+ allowing up to $75 million with lighter disclosure than full registrations, and Regulation D private placements restricted to accredited investors. Proposals to raise Reg CF limits to $15 million and expand accredited investor definitions suggest continued regulatory evolution favoring market growth over restriction. Understanding equity crowdfunding regulations is essential for both investors and businesses.
Institutional participation accelerates market professionalization. Family offices and registered investment advisors allocated an estimated $3.2 billion to P2P equity platforms in 2023, up from $780 million in 2020. This capital brings sophisticated due diligence standards, demands for better reporting, and pressure for secondary market development. Platforms courting institutional investors implement stricter company vetting, reducing acceptance rates from 5% to 2% of applicants.
Technology integration promises improved risk assessment and fraud detection. Machine learning models now analyze company financial projections against industry benchmarks, flagging outliers for enhanced review. Blockchain-based cap table management enables real-time ownership verification and automated dividend distributions. These innovations should reduce platform operational risks by 30% to 40% over the next three years.
Practical Steps for Portfolio Construction
Asset allocation starts with defining investment objectives and constraints. Investors seeking aggressive growth with 10 to 15-year horizons can allocate 10% to 20% of equity portfolios to P2P opportunities. Those approaching retirement or requiring liquidity should limit exposure to 2% to 5% of total assets. Define maximum loss tolerance in absolute dollar terms—the amount you can lose completely without altering retirement plans or lifestyle.
Diversification across vintage years smooths return volatility. Spreading investments equally across three to four years reduces concentration risk from adverse economic cycles affecting specific cohorts. A $60,000 allocation might deploy $15,000 annually over four years into 5 to 8 companies per year, creating a 20 to 32 position portfolio by year four. Exploring alternative investment through P2P trading can provide additional diversification benefits.
Sector and stage diversification balances risk-reward profiles. Combine early-stage, high-growth technology investments with later-stage, slower-growth consumer businesses. Allocate 40% to 50% to sectors where you possess professional expertise, 30% to 40% to adjacent industries, and 10% to 20% to compelling opportunities in unfamiliar domains where management quality compensates for your knowledge gaps.
Regular rebalancing requires discipline despite illiquidity. As some positions appreciate significantly, they may dominate portfolio weight. While you cannot easily sell to rebalance, you can direct new capital toward underweighted categories. Establish rules like limiting any single position to 15% of P2P equity allocation regardless of paper gains, achieved by reducing allocation percentages to that company in subsequent funding rounds. Those looking to invest a lump sum for monthly income should carefully consider the illiquidity constraints of P2P equity investments.
The democratization of equity investment through P2P platforms creates genuine opportunities for informed investors willing to accept illiquidity and elevated risk. Success requires rigorous company evaluation, platform selection diligence, appropriate portfolio sizing, and realistic
