Why Trading Deserves a Serious Look for Mid-Tier Capital
Ten thousand dollars sits in an interesting space. It's too much to gamble recklessly, yet too modest for traditional wealth management firms to roll out the red carpet. Peer-to-peer trading platforms have filled this gap with precision. Data from the Cambridge Centre for Alternative Finance shows P2P lending and trading volumes topped $366 billion globally in 2022, with individual transaction sizes clustering around the $5,000 to $25,000 range.
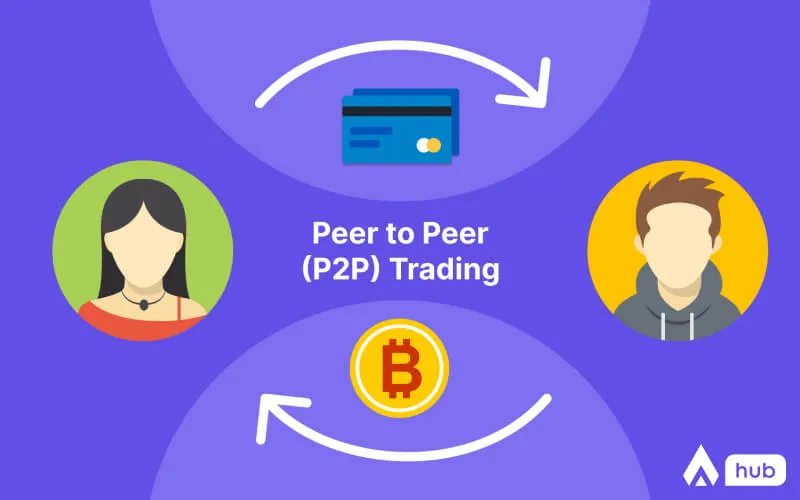
The fundamental value proposition remains straightforward. P2P markets eliminate intermediaries and connect capital directly with opportunity. When you invest through traditional brokerages, layers of fees, clearing houses, and market makers take their cut. P2P structures compress these costs while offering returns that institutional investors have accessed for decades.
Three factors make P2P trading particularly relevant for $10,000 deployments right now. First, platform sophistication has matured dramatically since the sector's Wild West phase. Second, regulatory frameworks in major jurisdictions have stabilized, creating clearer operating boundaries. Third, the current interest rate environment makes 6-12% annual yields from well-structured P2P positions genuinely attractive compared to money market alternatives.

Risk Architecture: The Foundation of Any Strategy
Before allocating a single dollar, you need a brutally honest risk assessment. P2P trading carries default risk, platform risk, liquidity risk, and regulatory risk simultaneously. Industry data from LendingClub's historical loan book shows cumulative default rates between 4-8% depending on credit grade, and that's for a platform with institutional backing and rigorous underwriting.
The mathematics matter here. If you chase a 12% annual return but experience an 8% default rate, your net return collapses to 4% before fees. Factor in platform charges averaging 1-2%, and you're looking at real returns around 2-3%. That's barely ahead of inflation in many economies.
Smart capital preservation starts with position sizing. No single P2P trade should represent more than 5% of your $10,000. This means a minimum of 20 separate positions if you're deploying the full amount immediately. Research from the Federal Reserve Bank of Cleveland analyzing marketplace lending data found that portfolios with 50+ loans experienced 40% less volatility than concentrated portfolios.
Set hard loss limits before you begin. If you're targeting 10% annual returns, capping potential losses at 15% of deployed capital creates asymmetric upside. This discipline forces you to exit deteriorating positions before hope becomes a strategy. Maclear offers tools to help investors maintain this discipline across multiple positions.
Platform Selection: Due Diligence That Actually Matters
Not all P2P platforms operate under equivalent standards. Jurisdictional differences create wildly different investor protections. UK-based platforms regulated by the Financial Conduct Authority must maintain segregated client funds and produce regular audit reports. Caribbean-domiciled platforms operating in regulatory gray zones offer no such guarantees.
Start with platform tenure and transaction volume. Any platform operating less than three years lacks a full credit cycle in its track record. You need to see how they performed during stress periods. Platforms that launched after 2020 haven't faced a genuine recession with rising default rates.
Examine the underlying collateral or business model for trades. Some P2P platforms facilitate invoice financing, where businesses sell unpaid invoices at a discount. These typically carry 60-90 day terms with recovery rates above 70% when defaults occur. Others focus on unsecured consumer loans with five-year terms and recovery rates below 30%. The risk-return profiles differ enormously.
Platform fee structures reveal much about incentive alignment. Fixed-percentage fees on successful transactions align platform interests with yours. Platforms charging upfront fees regardless of outcome create moral hazard. They profit whether your capital preserves or evaporates.
Geographic diversification across platforms reduces single-jurisdiction risk. Spreading $10,000 across three platforms in different regulatory environments means no single government policy shift wipes out your positions. European platforms, Asian markets, and Western exchanges each operate under distinct frameworks. When evaluating options, it's worth taking time to compare P2P investment platforms systematically.
Asset Class Mixing Within Ecosystems
The P2P universe extends far beyond basic consumer lending. Modern platforms facilitate trading in invoice financing, supply chain funding, real estate fractional ownership, revenue-based business financing, and cryptocurrency-collateralized lending. Each carries distinct risk characteristics and return profiles.
Invoice financing typically offers the shortest duration and highest recovery rates. When a manufacturing company sells a $50,000 invoice due in 60 days at a 4% discount, you're essentially making a short-term trade backed by an established business relationship. Default rates in quality invoice financing platforms run 2-3% annually according to data from the International Factoring Association.
Real estate fractional ownership through P2P platforms has gained traction since 2019. These structures let you participate in property cash flows and appreciation with positions starting around $500. Analysis of real estate crowdfunding platforms by the University of Cambridge found average annual returns of 8.7% between 2016-2021, though liquidity remains limited with typical holding periods of 3-5 years. Understanding how does crowdfunding work helps investors evaluate these opportunities more effectively.
Revenue-based financing represents the fastest-growing P2P category. Businesses receive capital in exchange for a percentage of future revenues until a predetermined return multiple is reached. This aligns investor and entrepreneur incentives since repayment accelerates as the business grows. Default rates hover around 6-8%, but successful positions can return 30-40% in 18-24 months.
For a $10,000 allocation, consider splitting across three asset classes. Place $4,000 in short-term invoice financing for stability and liquidity. Deploy $3,500 in revenue-based financing for growth potential. Allocate $2,500 to real estate fractional ownership for diversification and inflation hedging.
The Reinvestment Compounding Strategy
The mathematical power of P2P trading emerges through systematic reinvestment. Starting with $10,000 earning 10% annually grows to $11,000 after year one. If you withdraw that $1,000 profit, you restart year two with $10,000. But reinvesting the full $11,000 generates $1,100 in year two, then $1,210 in year three. Over five years, reinvestment produces $6,105 in gains versus $5,000 with annual withdrawals.
This compounds fastest when you establish an automated reinvestment protocol. Set a minimum cash buffer—perhaps $500—for liquidity needs. Route all returns above that threshold back into new positions following your target allocation percentages. Most platforms now offer auto-invest functions that deploy returning capital according to pre-set criteria.
Watch for reinvestment timing inefficiencies. Capital sitting idle between position maturities and reinvestment earns nothing. Platforms that return principal and interest to a zero-yield holding account create drag. Some advanced platforms offer dynamic redeployment where maturing positions automatically roll into a queue of available opportunities, minimizing dead time.
Tax efficiency varies dramatically by jurisdiction. In the United States, P2P returns are typically taxed as ordinary income rather than capital gains, creating a higher tax burden. Using tax-advantaged accounts like self-directed IRAs for P2P trading when regulations permit can boost after-tax returns significantly. A 10% gross return taxed at 24% yields 7.6% after-tax, versus 10% in a tax-deferred account. This approach aligns well with strategies for income investing that prioritize tax-efficient returns.
Risk Mitigation Through Technical Analysis
P2P platforms generate extensive data on borrower behavior, platform performance, and market conditions. Sophisticated investors mine this information to refine position selection. Default prediction models using platform data have shown accuracy rates above 75% in academic studies.
Key variables matter more than others. For consumer loans, debt-to-income ratio consistently predicts default risk better than credit scores alone. Borrowers with DTI above 40% default at roughly double the rate of those below 25%, based on analysis of 2.4 million loans by researchers at MIT.
Platform-level metrics provide early warning signals. Watch transaction volumes, average loan sizes, and approval rates. A platform that suddenly loosens underwriting standards to boost volume often experiences rising defaults 6-12 months later. When approval rates jump above historical norms by more than 15%, tighten your own selection criteria or reduce exposure.
Secondary market activity on platforms that offer trading reveals price discovery and sentiment. When loans begin trading at discounts exceeding 10-15%, it signals deteriorating confidence in specific loan types or the platform itself. This information arrives months before official default statistics reflect problems.
Build simple tracking systems for your positions. Spreadsheet monitoring of payment consistency, communication quality from platforms, and performance versus expectations creates accountability. Positions that miss payments or show irregular patterns deserve immediate attention and potential early exit even at a loss.
Exit Strategies and Liquidity Planning
The best way to invest 10k through P2P trading includes clear exit planning before entry. Unlike publicly traded securities, P2P positions often lack liquid secondary markets. Your capital may lock up for months or years depending on the structure.
Stagger position maturities deliberately. If you deploy $10,000 across 25 positions all maturing in three years, you create a liquidity cliff. Instead, structure positions with maturities ranging from 60 days to 36 months. This ensures regular capital return for redeployment or withdrawal.
Secondary markets exist on major platforms but typically charge 2-5% transaction fees and require price concessions for quick sales. Research from Brismo analyzing secondary market activity found that loans trading before maturity sold at average discounts of 7.3%, erasing much of the yield advantage. Reserve secondary market exits for genuine emergencies.
Emergency liquidity needs suggest keeping 15-20% of your $10,000 in positions with sub-90-day maturities. This slice can convert to cash quickly with minimal penalty. The remaining 80-85% can pursue higher returns in longer-duration opportunities.
Platform bankruptcy remains a tail risk that demands attention. While regulated platforms maintain segregated client assets, the recovery process can take 12-24 months. Diversifying across multiple platforms means a single platform failure doesn't freeze your entire capital base.
Performance Monitoring and Portfolio Adjustment
Set quarterly review intervals as a minimum. P2P portfolios require more active management than passive index funds. During reviews, calculate actual returns including defaults, compare against benchmarks, and assess whether platform quality remains consistent.
Benchmark against appropriate alternatives. A P2P portfolio targeting 10% returns should outperform on a risk-adjusted basis against high-yield bond funds or dividend stocks. If your actual returns after defaults, fees, and time costs fall below 7%, you're not receiving adequate compensation for the risks and illiquidity you're accepting.
Platform quality deteriorates predictably in certain patterns. Rising customer complaints on independent review sites, lengthening response times to investor inquiries, delayed platform updates, and unexplained fee increases all signal declining operational quality. Exit positions on platforms showing multiple red flags even if individual positions perform adequately.
Rebalance across asset classes and platforms semi-annually. As positions mature at different rates, your allocation drifts from targets. If real estate positions grow to 40% of your portfolio when you targeted 25%, the excess concentration increases risk. Redirect maturing capital to underweight categories.
Tax Optimization and Record Keeping
P2P trading generates complex tax situations. Each position that returns interest creates a taxable event. Platforms operating across borders may trigger withholding tax complications. Default losses may qualify as capital losses in some jurisdictions but ordinary losses in others.
Maintain meticulous records from day one. Download monthly statements from all platforms. Record every deposit, every position opened, every payment received, and every default or loss. Tax authorities increasingly scrutinize P2P income as the sector grows. Incomplete records create audit vulnerability.
Loss harvesting provides one of the few tax optimization levers available. When positions default or deteriorate, realizing those losses can offset other income. In jurisdictions allowing capital loss carryforwards, strategic loss realization in high-income years reduces overall tax burden.
Different platforms provide varying quality of tax reporting. Those issuing consolidated annual statements simplify filing. Platforms requiring manual calculation of each position's income create administrative burdens. Factor reporting quality into platform selection if you're managing dozens of positions.
Consider professional tax guidance if your P2P portfolio exceeds $5,000 or spans multiple jurisdictions. The cost of a specialized tax consultation—typically $200-500—pays for itself through optimized reporting and reduced audit risk.
The Behavioral Edge in Markets
P2P trading rewards patience and discipline more than traditional securities trading. Markets lack the minute-by-minute price discovery of stock exchanges. This creates both advantage and danger.
The advantage comes from reduced emotional volatility. You can't panic-sell a P2P position at 2 AM based on overnight news. The forced holding period prevents the behavioral errors that plague equity investors. Studies of investor returns consistently show that forced illiquidity improves long-term outcomes for most individuals.
The danger emerges when locked capital prevents response to genuine deterioration. A borrower who stops communicating, a platform facing regulatory action, or a macro environment shifting dramatically may warrant exit. But if no secondary market exists, you ride declining positions to maturity or total loss.
Successful P2P investors develop pattern recognition. After monitoring 50-100 positions, you identify which early warning signs predict problems. Borrowers who communicate proactively about minor payment delays often resolve issues. Those who go silent immediately after a missed payment default at much higher rates.
Maintain emotional discipline around defaults. In a properly diversified P2P portfolio targeting 10% returns, you should expect 4-6% of positions to experience some level of default. This isn't failure—it's the probability distribution playing out. Investors who exit the entire strategy after their first default never allow their edge to materialize across hundreds of trials.
